




Earnings Call/Transcript
Cera Sanitaryware Q2 FY27 Earnings Transcript
Cera Sanitaryware filed the transcript of its Q2 and H1 FY27 earnings call held on 5 November 2026, reporting strong revenue growth and sequential margin improvement.





IRIS
Multibagg AI is an AI powered stock research and analysis platform. We provide data, information, content, and analytics for publicly traded Indian companies listed on NSE and BSE. AI can make mistakes, check important information.
Prices might be delayed by a few minutes.
Join our Exclusive Community


Join our Exclusive Community
Made with 💙 in India. © Finsky Technologies Pvt Ltd. 2026


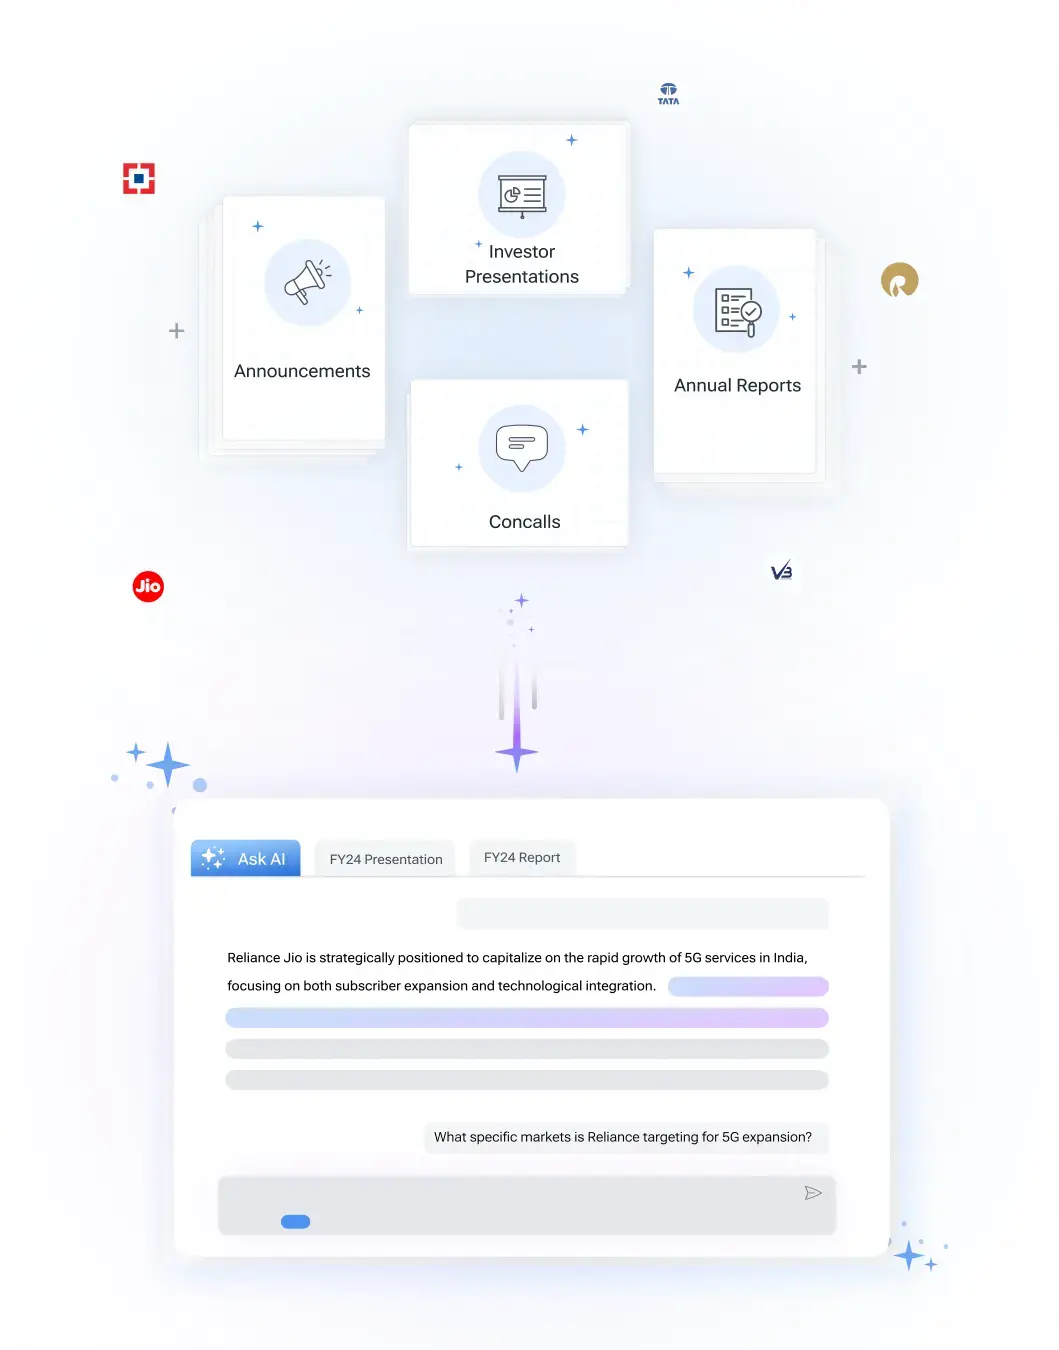
Get instant AI-powered insights about company performance, financials, and strategy. Ask questions about trends, competition, and developments while receiving responses backed by official documents and market data, with clear attribution to source documents.



Bearish
5
Neutral
5
Bullish
4
Bearish
18
Neutral
5
Bullish
23
Bearish
13
Neutral
0
Bullish
19
Bearish
13
Neutral
0
Bullish
19
Bearish
13
Neutral
0
Bullish
19
Bearish
13
Neutral
0
Bullish
19
 Discovery themes featuring this stock

View Standalone
View Standalone
View Standalone
View Standalone
View Standalone
View Standalone
View Standalone
View Standalone
Discovery themes featuring this stock




Cera Sanitaryware Limited manufactures, sells, and trades sanitaryware, faucetware, bathware, tiles, wellness products, kitchen sinks, mirrors, and related building products, with the CERA brand serving mass, mid-premium, and premium customers. The company combines in-house manufacturing with outsourcing, supported by a nationwide distribution network and retail-project channel presence.
Q2 FY27 revenue grew 27.4% year-on-year to INR 603 crore, with sanitaryware up 24% and faucetware up 38%. Growth was predominantly volume-led, while retail demand recovered alongside continued project execution, indicating that recent distribution, product, and market-development initiatives are translating into tangible market-share gains.
Profitability remained below the prior-year level despite strong revenue growth, as brass and gas costs increased sharply. EBITDA margin declined to 12.2% from 14.2% year-on-year, but improved materially from 10.1% in Q1 FY27, reflecting initial benefits from pricing, cost control, and operating leverage.
Cera Sanitaryware Limited reduced inventory days from 83 to 69 and receivable days from 33 to 28, bringing net working capital down from 77 to 58 days. With INR 897 crore of cash and first-half capex of INR 27 crore against a planned INR 43 crore, the balance sheet offers considerable strategic flexibility.
Management expects to exceed its earlier 18%–20% FY27 revenue-growth target while retaining the 13%–14% full-year EBITDA-margin outlook. The key earnings inflection is expected in Q3 and Q4, as September faucet price increases, revised project pricing, lower discounts, and efficiency initiatives progressively offset elevated input costs.
Consumer Durables
Sanitary Ware
6,429 Cr
Low Risk
25.9
43.7
2.2
4.7
6,729.95
4,397.85
Sales CAGR
Profit CAGR
ROE
ROCE

| Symbol | Watchlist | Price | Market Cap | P/E | P/B | Div Yield (%) | ROE (%) | ROCE (%) | ROA (%) |
366.90 | 7,110 Cr | 37.01 | 1.50 | 0.00 | 4.05 | 5.38 | 2.69 | ||
592.95 | 6,475 Cr | 28.44 | 1.93 | 0.17 | 7.49 | 8.53 | 4.40 | ||
1305.30 | 6,396 Cr | 41.25 | 5.35 | 0.31 | 12.96 | 15.33 | 9.54 | ||
4886.00 | 6,302 Cr | 25.38 | 4.66 | 1.54 | 18.21 | 21.93 | 13.33 | ||
199.55 | 6,100 Cr | 48.81 | 6.67 | 0.75 | 17.31 | 19.53 | 10.09 | ||
108.35 | 5,990 Cr | 23.60 | 6.08 | 1.85 | 25.76 | 22.28 | 10.47 | ||
3212.60 | 5,445 Cr | 31.15 | 6.07 | 0.00 | 19.48 | 23.78 | 15.51 | ||
| Median: 7 Co. | — | 592.95 | 6,302 Cr | 31.15 | 5.35 | 0.31 | 17.31 | 19.53 | 10.09 |
Cera Sanitaryware Ltd (CERA) is currently trading at 4,985.00 per share. Stock prices fluctuate during market hours on NSE and BSE based on demand, company updates, and overall market conditions. Refer to the live price chart above for the most recent price movement.
Cera Sanitaryware Limited manufactures, sells, and trades sanitaryware, faucetware, bathware, tiles, wellness products, kitchen sinks, mirrors, and related building products, with the CERA brand serving mass, mid-premium, and premium customers. The company combines in-house manufacturing with outsourcing, supported by a nationwide distribution network and retail-project channel presence. Q2 FY27 revenue grew 27.4% year-on-year to INR 603 crore, with sanitaryware up 24% and faucetware up 38%. Growth was predominantly volume-led, while retail demand recovered alongside continued project execution, indicating that recent distribution, product, and market-development initiatives are translating into tangible market-share gains. Profitability remained below the prior-year level despite strong revenue growth, as brass and gas costs increased sharply. EBITDA margin declined to 12.2% from 14.2% year-on-year, but improved materially from 10.1% in Q1 FY27, reflecting initial benefits from pricing, cost control, and operating leverage. Cera Sanitaryware Limited reduced inventory days from 83 to 69 and receivable days from 33 to 28, bringing net working capital down from 77 to 58 days. With INR 897 crore of cash and first-half capex of INR 27 crore against a planned INR 43 crore, the balance sheet offers considerable strategic flexibility. Management expects to exceed its earlier 18%–20% FY27 revenue-growth target while retaining the 13%–14% full-year EBITDA-margin outlook. The key earnings inflection is expected in Q3 and Q4, as September faucet price increases, revised project pricing, lower discounts, and efficiency initiatives progressively offset elevated input costs.
Over the past 52 weeks, Cera Sanitaryware Ltd has traded between a low of ₹4,397.85 and a high of ₹6,729.95. The 52-week high and low indicate the stock’s price range over the last year and help investors understand its volatility and recent trading levels.
Cera Sanitaryware Ltd has a market capitalization of approximately 6,301.74. Market capitalization represents the total value of a company’s outstanding shares and helps investors understand its size, stability, and relative risk compared to other listed companies.
Cera Sanitaryware Ltd’s investment profile depends on its business fundamentals, valuation, and long-term outlook. The stock currently trades at a PE ratio of 25.38 and operates in the its sector sector. Investors typically assess financial performance, growth prospects, and individual risk tolerance before making investment decisions.
Based on its market capitalization of 6,301.74 Cr, Cera Sanitaryware Ltd is classified as a Small Cap stock. Large-cap stocks are generally more stable, while mid-cap and small-cap stocks tend to offer higher growth potential along with higher price volatility.
Cera Sanitaryware Ltd operates in the its sector sector. Sector classification matters because companies in the same sector are often affected by similar economic conditions, regulatory changes, and competitive dynamics, which can influence overall stock performance.
The Price-to-Earnings (PE) ratio of Cera Sanitaryware Ltd is 25.38. The PE ratio compares a company’s share price to its earnings and is commonly used to assess valuation. Comparing the PE ratio with sector peers and historical levels provides better context.
CERA said the increase from 4 lakh to 5 lakh faucetware pieces a month became effective in September. Management attributed the addition to extra equipment and adjustments within the existing manufacturing facility.
CERA reported a 12.2% EBITDA margin in Q2 FY27, down from 14.2% in Q2 FY26. Management attributed 2.1 percentage points of pressure to brass, 1.7 points to discounts, 0.5 points to publicity and 0.3 points to higher sanitaryware and tiles procurement costs.
Cera reported revenue from operations of ₹603 crore in Q2 FY27. This was 27.4% higher than ₹473.4 crore reported in Q2 FY26.
Cera approved the proposed reappointment of Vikram Somany from 1 July 2027. The term is for five years and remains subject to approval by Cera's members.


