










Classic Electrodes cuts debt-equity to 0.36 in FY26 as returns fall
Key highlights
- Classic Electrodes reported a debt-equity ratio of 0.36 times in FY26, versus 1.20 times in FY25.
- Classic Electrodes' FY26 revenue from operations rose 18.06% to Rs 242.97 crore.
- Classic Electrodes' EBITDA margin declined to 9.78% in FY26 from 11.85% in FY24.
- Classic Electrodes' current ratio increased to 2.25 times in FY26 from 1.45 times in FY25.
powered by IRIS
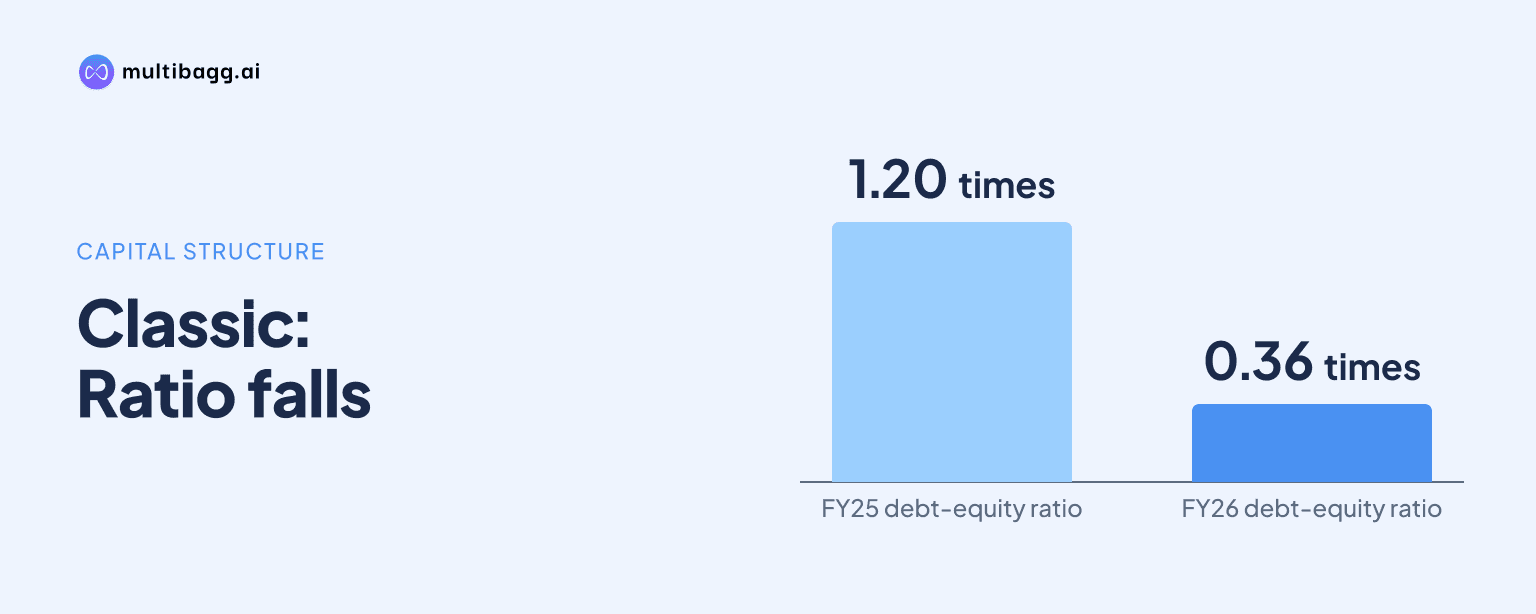
Classic Electrodes reported a debt-equity ratio of 0.36 times in FY26, down from 1.20 times in FY25 and 1.36 times in FY24, while EBITDA margin declined to 9.78% and return on net worth fell to 14.32%. Revenue from operations nevertheless rose 18.06% to Rs 242.97 crore in FY26.
Know Classic Electrodes (India) inside out
Results, valuation, peers and who's buying, in one view.
How much did Classic Electrodes reduce leverage in FY26?
Classic Electrodes reported a debt-equity ratio of 0.36 times in FY26, a reduction of 0.84 times from FY25 and 1.00 time from FY24. The three-year trend shown in the presentation is 1.36 times in FY24, 1.20 times in FY25 and 0.36 times in FY26, indicating a materially lower reported leverage measure in the latest year.
The balance sheet records short-term borrowings of Rs 18.61 crore in FY26, down from Rs 52.09 crore in FY25 and Rs 43.14 crore in FY24. Long-term borrowings also declined to Rs 89.82 lakh from Rs 2.30 crore in FY25 and Rs 2.59 crore in FY24. The presentation reports both borrowings and the debt-equity ratio, but does not provide a separate reconciliation explaining the ratio calculation.
Share capital increased to Rs 17.97 crore in FY26 from Rs 13.19 crore in FY25, while reserves and surplus rose to Rs 77.24 crore from Rs 32.01 crore. These reported equity balances changed alongside the decline in borrowings, although the presentation does not attribute the debt-equity movement to any one balance-sheet item or financing action.
Did Classic Electrodes grow revenue and profit in FY26?
Classic Electrodes grew revenue from operations by 18.06% to Rs 242.97 crore in FY26, and profit after tax increased to Rs 12.64 crore from Rs 11.62 crore in FY25. Revenue had risen 6% in FY25 to Rs 205.79 crore, following Rs 193.82 crore in FY24, so FY26 represented a faster reported revenue-growth rate than the preceding year.
Earnings before interest, tax, depreciation and amortisation, or EBITDA, reached Rs 23.87 crore in FY26, exceeding Rs 22.28 crore in FY25 but only modestly above Rs 23.22 crore in FY24. Profit before tax increased to Rs 17.05 crore from Rs 14.88 crore in FY25, while finance costs declined to Rs 3.62 crore from Rs 5.10 crore.
Total income rose by Rs 38.08 crore year on year in FY26, whereas EBITDA increased by Rs 1.59 crore. This difference is reflected in the reported margin trend. Other income was Rs 1.25 crore in FY26, compared with Rs 0.33 crore in FY25 and Rs 2.10 crore in FY24, showing that the latest year's total-income increase was mainly associated with the higher revenue from operations figure rather than a rise in other income.
Got a follow-up? Ask IRIS
Why did Classic Electrodes' margins and returns decline?
Classic Electrodes' EBITDA margin declined for a second consecutive year to 9.78% in FY26, from 10.81% in FY25 and 11.85% in FY24. Its profit-after-tax margin also moved down to 5.18% in FY26 from 5.64% in FY25, although it remained above the 4.88% reported in FY24.
The cost lines changed unevenly across the period. Cost of material consumed increased to Rs 135.70 crore in FY26 from Rs 95.91 crore in FY25, while purchases of stock-in-trade decreased to Rs 64.47 crore from Rs 69.39 crore. Operational and manufacturing expenses were largely steady at Rs 10.93 crore versus Rs 10.94 crore, but depreciation and amortisation rose to Rs 3.15 crore from Rs 2.29 crore.
Return on net worth, or RONW, fell to 14.32% in FY26 from 25.70% in FY25 and 28.45% in FY24. Return on capital employed, or ROCE, similarly declined to 17.23% from 20.07% and 26.52%, respectively. The presentation supplies the ratios but does not disclose their underlying calculation methodology or identify a specific driver for the changes.
The contrast is that FY26 profit after tax was Rs 12.64 crore, the highest of the three reported years, while both return measures were at their lowest levels in the same three-year series. The presentation also shows share capital and reserves rising sharply in FY26, but it does not state whether the larger equity base was the reason for the lower RONW.
What changed in Classic Electrodes' balance sheet and liquidity?
Classic Electrodes reported total assets of Rs 134.10 crore in FY26, up from Rs 115.16 crore in FY25 and Rs 92.20 crore in FY24, while its current ratio increased to 2.25 times from 1.45 times and 1.37 times. The current ratio is the presentation's stated liquidity measure and improved by 0.80 times in FY26.
Property, plant and equipment rose to Rs 26.58 crore from Rs 17.21 crore in FY25, and capital work-in-progress was Rs 4.39 crore after no balance was shown for either FY25 or FY24. Non-current investments increased to Rs 2.28 crore from Rs 32.54 lakh. These asset changes occurred as total balance-sheet assets expanded by Rs 18.95 crore from FY25.
Inventory declined slightly to Rs 38.02 crore in FY26 from Rs 38.79 crore in FY25, despite revenue from operations increasing by Rs 37.18 crore. Trade receivables increased to Rs 47.64 crore from Rs 42.76 crore, while cash and cash equivalents rose to Rs 5.04 crore from Rs 1.55 crore. Short-term loans and advances fell to Rs 8.16 crore from Rs 14.60 crore.
On the liabilities side, trade payables to parties other than micro, small and medium enterprises rose to Rs 9.48 crore in FY26 from Rs 8.07 crore in FY25. Other current liabilities increased to Rs 4.08 crore from Rs 2.45 crore, while short-term provisions edged up to Rs 4.40 crore from Rs 4.21 crore. Total liabilities and shareholders' funds were each Rs 134.10 crore, matching the reported total assets.
Conclusion
Classic Electrodes' FY26 financial data show a lower reported debt-equity ratio, lower short-term and long-term borrowings, and a higher current ratio alongside growth in revenue, total income and profit after tax. At the same time, EBITDA margin fell from 11.85% in FY24 to 9.78% in FY26, and both RONW and ROCE declined across the three reported financial years.
The next disclosure to watch is the Rs 4.39 crore capital work-in-progress recorded in FY26, as no balance was shown in FY24 or FY25 and the presentation does not state its purpose or expected completion. The presentation also does not disclose a financial target, capital-allocation plan or scheduled operating event that would clarify the direction of margins, returns or leverage.