










Clean Max Enviro Energy Solutions Reports 56% H1 EBITDA Growth
Key highlights
- Clean Max reported H1 FY27 EBITDA of ₹1,047 crore, up 56% from ₹670 crore in H1 FY26.
- Q2 FY27 EBITDA was ₹553 crore, compared with ₹386 crore in the corresponding quarter a year earlier.
- Revenue from operations grew by about 67% in H1 FY27, according to management.
- Clean Max's aggregate renewable portfolio reached about 13.2 GW as of September 30, 2026, versus about 7.8 GW 18 months earlier.
powered by IRIS
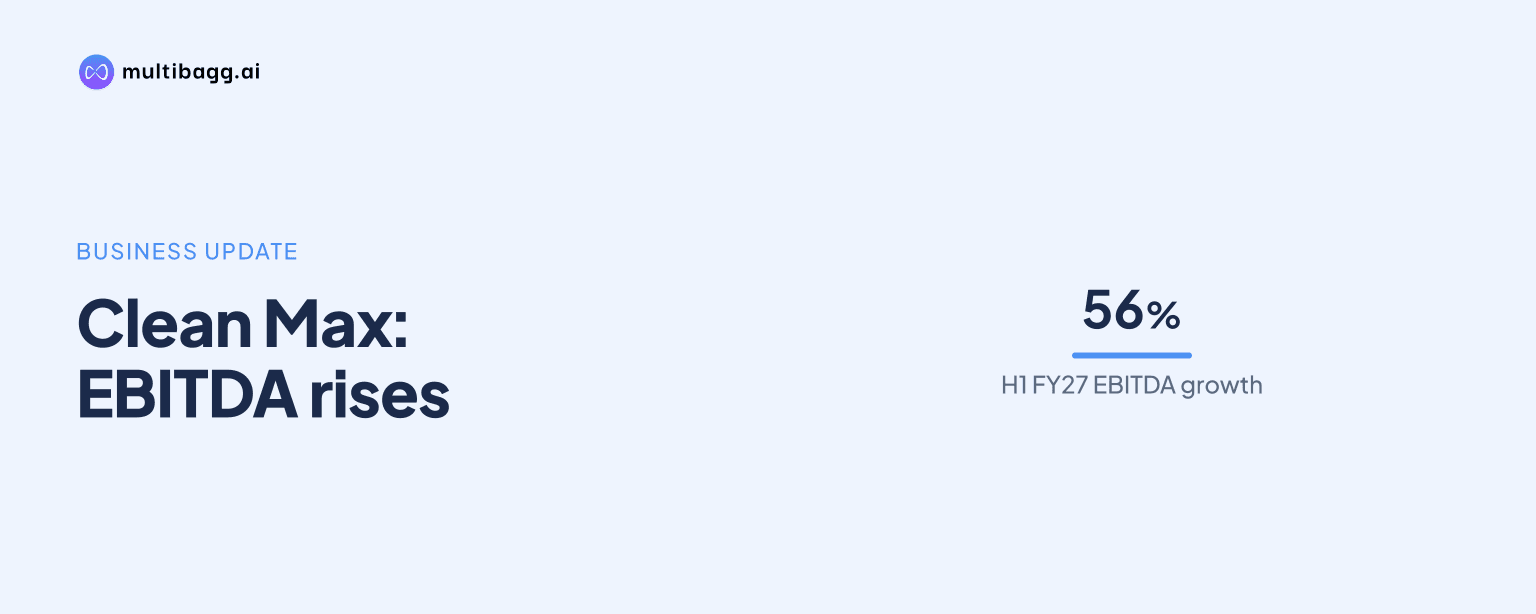
Clean Max Enviro Energy Solutions Limited reported EBITDA of ₹1,047 crore for the first half of FY27, a 56% increase from ₹670 crore a year earlier, supported by growth in renewable power sales and continued project commissioning. The company also reported quarterly EBITDA of ₹553 crore for the quarter ended September 30, 2026.
Know Clean Max Enviro Energy Solutions inside out
Results, valuation, peers and who's buying, in one view.
How did Clean Max perform in H1 FY27?
Clean Max reported a substantial improvement in operating earnings during the first half of FY27. Consolidated EBITDA rose to ₹1,047 crore from ₹670 crore in the corresponding period of FY26. For the September quarter, EBITDA stood at ₹553 crore, compared with ₹386 crore in the year-earlier quarter.
Management said revenue from operations grew by about 67% in H1 FY27. Renewable energy power sales revenue roughly doubled on a half-year basis, while renewable energy services recorded modest quarter-on-quarter growth. The mix indicates that operating assets and newly commissioned capacity were important contributors to the half-year performance.
The earnings update was discussed during Clean Max's conference call for the quarter and half year ended September 30, 2026. The company released the call recording on November 4, 2026, under its investor communication disclosures.
What is driving Clean Max's renewable power sales growth?
Clean Max said it commissioned around 600 MW in its renewable energy power sales segment during the first half of FY27. Commissioning is significant for this business because projects begin contributing to operational power sales once they are completed and supplying customers under contracted arrangements.
The company reported 6.3 GW of contracted renewable energy power sales capacity. Of this, approximately 3.6 GW was operational, while another 2.6 GW was contracted and under execution. The individual figures are rounded management disclosures and may not add precisely to the reported contracted total.
The operational portfolio provides the base for current power sales, while projects under execution represent contracted capacity that has yet to enter operations. Clean Max did not provide a project-wise commissioning schedule, customer list, tariff detail, or capital expenditure figure in the supplied call extract.
How large is Clean Max's current renewable portfolio?
Clean Max's aggregate portfolio had increased to about 13,200 MW, or 13.2 GW, as of September 30, 2026. Management compared this with a portfolio of about 7.8 GW around 18 months earlier, showing a 5.4 GW increase over that period.
The aggregate portfolio is broader than the 6.3 GW contracted renewable power sales figure because management presented it as the sum total of its portfolio. The call extract does not provide a detailed reconciliation of portfolio categories, so the reported figures should be viewed in the context in which management presented them.
Clean Max is building plants across 10 Indian states. Seven states have operational projects, while projects in three additional states are contracted and under execution. This geographic spread places the company among renewable developers operating across multiple state-level power markets and project environments.
Got a follow-up? Ask IRIS
Why do the H1 results matter for investors?
The 56% increase in H1 EBITDA and about 67% growth in revenue from operations show that Clean Max's operating performance improved as capacity was commissioned and renewable power sales expanded. The rise in quarterly EBITDA to ₹553 crore also provides the latest reported operating earnings measure for the September quarter.
For investors, the key operating indicators remain the conversion of the 2.6 GW under execution into commissioned assets, the performance of the 3.6 GW operational base, and the company's ability to maintain growth in renewable power sales. The supplied transcript extract does not state profit after tax, net debt, margins, project returns, or a revised full-year financial target.
The broader backdrop is continued corporate demand for contracted renewable electricity in India, where industrial and commercial users seek cleaner power supply arrangements. However, Clean Max's update does not quantify the market opportunity or offer forecasts for industry demand, electricity pricing, or future financial performance.
What should investors track after the September quarter?
Investors should track capacity commissioning, especially the movement of contracted projects into operations. The 600 MW commissioned in the first half of FY27 helped expand the operating base, and subsequent disclosures can show whether execution remains aligned with the company's contracted portfolio.
Investors may also monitor future quarterly disclosures for revenue, EBITDA, profitability, financing and project-level execution details. Clean Max has stated that it is constructing projects in three states where it does not yet have operational assets, making progress across those locations relevant to the next stage of portfolio growth.
Conclusion
Clean Max delivered higher operating earnings in H1 FY27, with EBITDA rising 56% year-on-year to ₹1,047 crore and revenue from operations growing by about 67%. The result coincided with approximately 600 MW of commissioned capacity and an aggregate portfolio that reached 13.2 GW by September 30, 2026.
The next disclosures should clarify the pace at which the 2.6 GW contracted and under-execution power sales portfolio becomes operational, along with the financial contribution from new assets. Management has also identified three states where projects are under execution, making their commissioning progress an important operational measure to watch.