










CleanMax backlog covers 20 months at planned build rate
Key highlights
- CleanMax reported 2.6 GW of contracted capacity under execution, equal to roughly 20 to 21 months at a 1.5 GW annual build rate.
- Operational renewable power-sales capacity reached 3.6 GW after about 600 MW was commissioned in H1 FY27.
- H1 FY27 EBITDA rose 56% to Rs 1,047 crore from Rs 670 crore a year earlier.
- Aggregate portfolio size increased to 13.2 GW as of September 30, 2026, from 7.8 GW 18 months earlier.
powered by IRIS
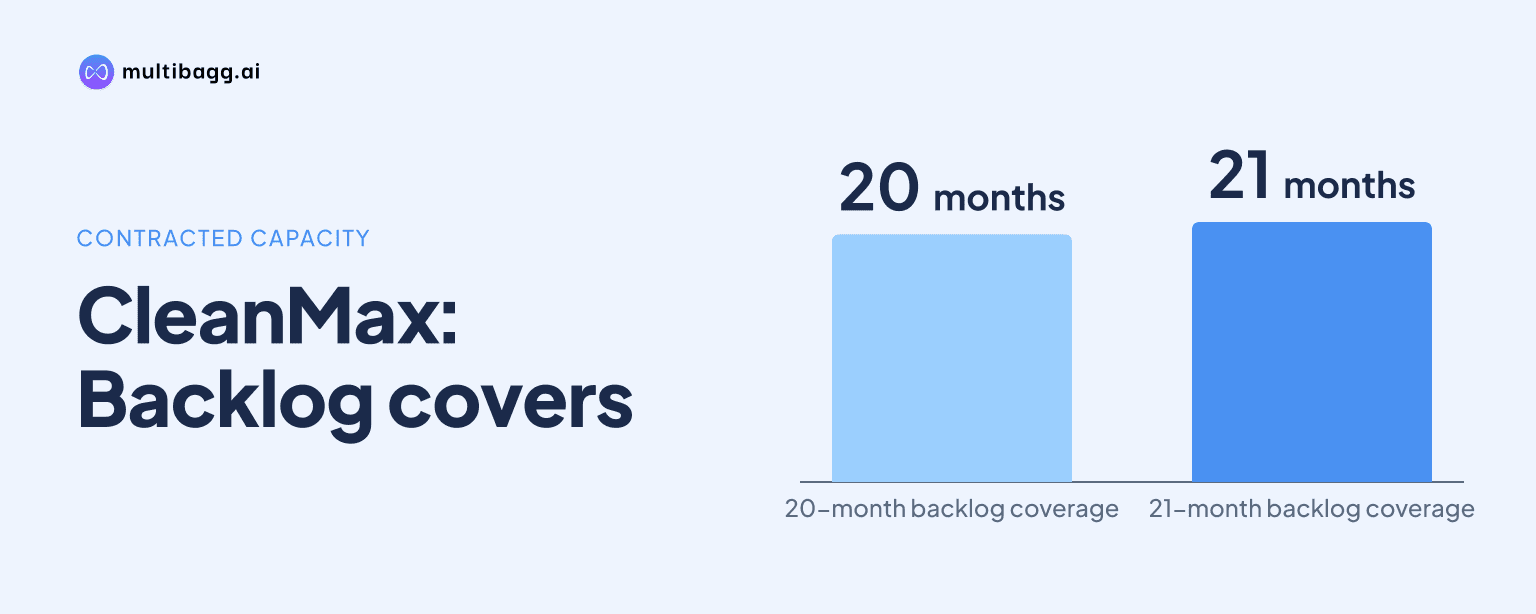
Clean Max Enviro Energy Solutions Limited said on November 4, 2026 that its 2.6-gigawatt contracted and under-execution renewable-energy backlog covers roughly 20 to 21 months of growth at its planned annual build rate of 1.5 GW. CleanMax had 3.6 GW of operational renewable power-sales capacity after commissioning about 600 MW in H1 FY27.
Know Clean Max Enviro Energy Solutions inside out
Results, valuation, peers and who's buying, in one view.
How long does CleanMax's contracted backlog cover?
CleanMax said its 2.6 GW of contracted capacity under execution represents approximately 20 to 21 months of future growth when measured against a 1.5 GW annual capacity-addition rate. Management presented this backlog as the bridge between signed power-purchase agreements, or PPAs, and the conversion of those agreements into operational revenue-producing assets.
The 2.6 GW sits alongside 3.6 GW of operational renewable power-sales capacity, taking contracted power sales to 6.3 GW as presented by management. CleanMax commissioned about 600 MW in its renewable power-sales segment during H1 FY27, and said roughly 80% of those additions were in Gujarat, Karnataka, Maharashtra and Tamil Nadu.
The backlog is material relative to CleanMax's recent commissioning pace. The company said it added renewable power-sales capacity at about 1.4 GW annually on a trailing-12-month basis, while reiterating guidance for a minimum 1.5 GW of new capacity additions in the current fiscal year. That recent run rate is close to the annual pace used to calculate the 20-to-21-month coverage period.
What has changed in CleanMax's operating capacity?
CleanMax's operational renewable power-sales capacity increased to 3.6 GW from 1.712 GW as of March 2025, more than doubling over roughly 18 months. Management also referred to an intermediate level of 3.1 GW before the current 3.6 GW total, showing that commissioning continued through H1 FY27.
The change is concentrated but not limited to four industrial states. Gujarat, Karnataka, Maharashtra and Tamil Nadu account for roughly two-thirds of CleanMax's total capacity, while 80% of capacity added in the latest six months was in those states. Management said individual PPAs are generally around 13 MW, which creates customer diversification within each market.
CleanMax also operates a separate renewable-energy services segment with about 830 MW of operational capacity. The distinction matters because the 3.6 GW figure used in the backlog calculation applies to renewable power sales, whereas the services capacity is reported separately from the contracted power-sales portfolio.
What supports CleanMax's pipeline beyond contracted projects?
CleanMax reported 3.2 GW of evacuation capacity received as of September 30, 2026, compared with 1.1 GW 18 months earlier. Evacuation refers to grid access available for future projects; management said this capacity moves into the firm contracted category once a customer signs a PPA.
A further 2.8 GW of evacuation applications were pending as of September 30, 2026. Management described a progression in which applied-for evacuation becomes received evacuation, customers then sign up against it, and the resulting projects enter the contracted-under-construction bucket. This is the mechanism underlying the reported 13.2 GW aggregate portfolio, up from 7.8 GW 18 months earlier.
The pipeline's commercial base includes more than 600 corporate customers, according to management. Repeat business accounted for 85% of new PPAs signed in H1 FY27, compared with about 75% in each of the prior two financial years. CleanMax also said 83% of customers were rated AA, AAA or were multinational companies, and 95% were rated A or above.
Got a follow-up? Ask IRIS
Is CleanMax converting capacity growth into financial growth?
CleanMax reported Rs 1,047 crore of earnings before interest, tax, depreciation and amortisation, or EBITDA, in H1 FY27, up from Rs 670 crore in the corresponding period a year earlier. The 56% increase coincided with 600 MW of renewable power-sales commissioning during the half year and a larger operational asset base.
The renewable power-sales segment generated Rs 986 crore of H1 FY27 EBITDA, compared with Rs 620 crore in the prior-year period. Renewable-energy services EBITDA rose to Rs 60 crore from Rs 52 crore over the same comparison, meaning the power-sales segment accounted for most of the Rs 377 crore increase in group EBITDA.
Profit after tax rose to Rs 120 crore in H1 FY27 from Rs 19 crore a year earlier. Management attributed EBITDA growth primarily to asset operating performance and projects commissioned early in the half year, while also reporting that its projects commissioned in H1 FY27 came in at 95% of budgeted cost.
What could affect CleanMax's capacity conversion?
CleanMax identified grid curtailment at Bikaner as a factor that reduced H1 FY27 EBITDA by about 5%. Management said curtailment was 70% when the plant was newly commissioned in the first quarter, was nearly 50% in July and August, declined to 44%, and then reached 26% in October after grid upgrades and new sections were commissioned.
Management said H1 FY27 EBITDA growth would have been 61% rather than the reported 56% without the curtailment effect. However, it did not provide a completion date for a relevant Bikaner substation and associated lines, saying the timing was outside CleanMax's control. In contrast, management said grid connectivity at Koppal was ready and that it expected phased plant commissioning to start in December.
Financing is another execution variable as the company builds projects. Net debt stood at Rs 13,838 crore on September 30, 2026, while capital work in progress, or CapWIP, was about Rs 6,700 crore. CleanMax said its weighted average corporate borrowing cost was 8.3%, and 53.7% of outstanding debt was fixed-rate after a Rs 2,500 crore green bond completed in September.
Conclusion
CleanMax's stated 20-to-21-month contracted backlog coverage is based on a 2.6 GW under-execution book and a 1.5 GW annual construction target that is close to its 1.4 GW trailing-12-month commissioning rate. Operational power-sales capacity has risen from 1.712 GW in March 2025 to 3.6 GW, while evacuation received has increased from 1.1 GW to 3.2 GW over 18 months.
The next measures to watch are delivery against the minimum 1.5 GW capacity-addition guidance for the current fiscal year, progress in reducing Bikaner curtailment, and management's FY28 target of at least Rs 3,000 crore of reported EBITDA. CleanMax also said it expects Koppal commissioning to begin in phases from December, while the timing of further Bikaner transmission works remains unresolved.