










CleanMax fixes 53.7% debt after Rs 2,500 crore green bond
Key highlights
- CleanMax completed a Rs 2,500 crore AA-rated green bond in September at a weighted average cost of about 8.6%.
- Fixed-rate borrowings represented 53.7% of CleanMax's outstanding debt, while floating-rate debt represented 46%.
- CleanMax reported Rs 13,838 crore of net debt and about Rs 6,700 crore of CapWIP on 30 September 2026.
- CleanMax's overall EBITDA rose 56% in H1 FY27 while its corporate weighted average interest rate was 8.3%.
powered by IRIS
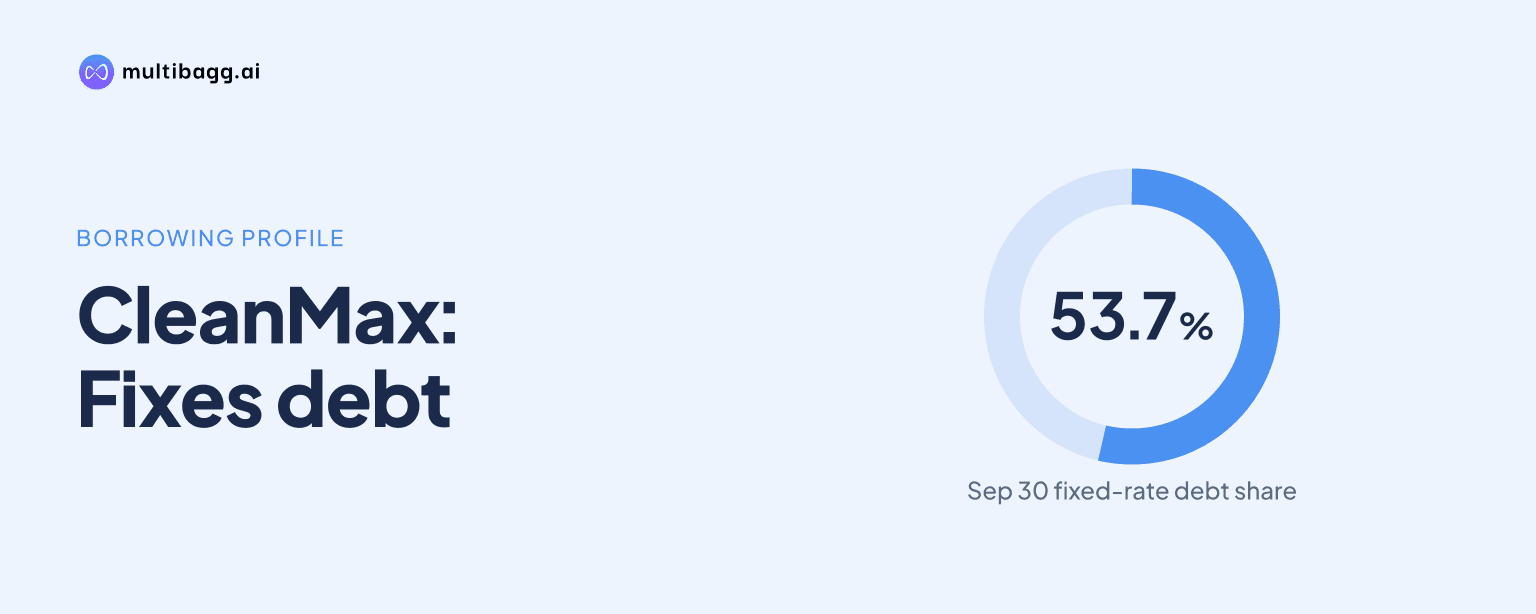
CleanMax fixed the interest rate on 53.7% of outstanding debt after completing a Rs 2,500 crore green bond in September, while its overall corporate weighted average interest rate was 8.3% in H1 FY27. Management said the transaction was intended to limit the effect of expected rate hardening on an expanding renewable-energy portfolio.
Know Clean Max Enviro Energy Solutions inside out
Results, valuation, peers and who's buying, in one view.
How did CleanMax change its debt mix?
CleanMax changed its debt mix by completing its first green bond in September, raising Rs 2,500 crore across maturities from two to 10 years. The bond was rated AA by CRISIL and carried a weighted average cost of about 8.6%, according to management. Following the issuance, fixed-rate debt represented 53.7% of outstanding borrowings and floating-rate debt accounted for 46%.
Management said the fixed-rate share had become important because interest rates were expected to harden over the next few quarters, after an increase by the Reserve Bank of India in the preceding quarter. It said fixing more than half the debt portfolio should help it navigate higher rates. Management added that, if rates rose by 50 basis points over the next six months, it hoped the overall weighted average rate would not exceed the level at which the fiscal year started.
The bond issue came alongside a corporate credit-rating upgrade to AA from CRISIL. Management presented the rating upgrade, the reduced weighted average borrowing rate and the larger fixed-rate component as related financing developments in H1 FY27. It did not disclose the fixed-rate share before the bond or the overall corporate borrowing rate at the start of FY27, so the precise period-on-period change in those measures cannot be calculated from the call.
What is CleanMax paying for its borrowings?
CleanMax reported a weighted average interest rate of 8.2% at the project level and 8.3% at the overall corporate level in H1 FY27. The 10-basis-point difference reflects the separate project-financing and corporate borrowing profiles described by management. A basis point is one-hundredth of a percentage point.
The new green bond's 8.6% weighted average cost was above the 8.3% corporate average, but the instrument locked rates for tenors ranging from two to 10 years. Management said it had reduced the overall weighted average rate during the first half while also increasing the fixed-rate proportion. Its comment that the rate might stay below the level at which FY27 began, even after a 50-basis-point increase, was an expectation rather than formal guidance.
The financing approach is relevant to CleanMax's capital expenditure programme. Gross block, meaning the value of fixed assets before depreciation, stood at Rs 15,182 crore on 30 September 2026, while capital work in progress, or CapWIP, was about Rs 6,700 crore. Management said capital expenditure was funded through debt, internal accruals and equity, and that the rising investment programme correspondingly increased net debt to Rs 13,838 crore.
How does CleanMax assess debt against operating assets?
CleanMax assessed borrowings against stabilised assets by identifying Rs 6,075 crore of debt attached to projects that had been operational for more than one year. Those assets generated about Rs 717 crore of earnings before interest, tax, depreciation and amortisation, or EBITDA, in H1 FY27. Management said this comparison loosely indicated net debt to EBITDA of less than five times for fully operationalised assets.
A further Rs 5,100 crore of debt was related to under-construction assets or was at the holding-company level, broadly corresponding to the Rs 6,700 crore of CapWIP reported on 30 September 2026. Management said the debt buildup reflected capital expenditure, while fully stabilised projects were self-servicing from the cash flows they generated. This distinguishes borrowings supporting operating projects from debt financing assets that are still being built.
CleanMax said it spends more than Rs 10,000 crore annually on capital expenditure and has added renewable capacity at about 1,400 megawatts a year on a trailing-12-month basis. The company also said plants commissioned in H1 FY27 came in at about 95% of budgeted cost, compared with a 95% to 97% range over the prior three fiscals. These execution measures explain management's focus on matching the debt profile with assets as they move into operation.
Got a follow-up? Ask IRIS
What operating growth supports CleanMax's financing plan?
CleanMax reported 56% overall EBITDA growth in H1 FY27, driven by generation from wind, solar and hybrid assets as well as projects commissioned during the period. In renewable-energy power sales, first-half EBITDA increased to about Rs 986 crore from Rs 620 crore a year earlier. Renewable-energy services EBITDA rose to about Rs 60 crore from Rs 52 crore, meaning both reported segments recorded growth.
Profit after tax increased to about Rs 120 crore in H1 FY27 from Rs 19 crore in the comparable prior-year period, while revenue from operations grew roughly 67%, management said. The EBITDA increase occurred alongside net debt of Rs 13,838 crore, showing that the company was adding operating earnings while funding further construction. CleanMax's operating leverage in renewable-energy power sales also increased, with segment EBITDA margin at 84%, compared with 83.5% in March 2026.
Management reiterated a minimum 1,500-megawatt capacity-addition target for the current fiscal year and said CleanMax would have at least Rs 3,000 crore of reported EBITDA in FY28. It said that a net-debt-to-EBITDA ratio of about five times on that EBITDA would imply net debt of Rs 15,000 crore to Rs 16,000 crore. Management framed this as a funding-capacity illustration, not as a declared net-debt target.
What could affect CleanMax's cash generation and debt profile?
CleanMax identified rate hardening as a macro financing risk because 46% of its outstanding debt remained floating rate after the September bond. Management said it was growing capital expenditure and EBITDA at about 50%, requiring a balance between expansion and financing. The fixed-rate debt component may reduce exposure to benchmark-rate movements, but management did not provide a sensitivity analysis for profit or cash flow.
Working-capital movements also affected cash flow in H1 FY27. Management said operating cash flow was negative by about Rs 200 crore because the company paid a vendor for wind-turbine deliveries after drawing down a loan. It described the payment as relating to capital creditors, although it was reflected in operating cash flow, and said payable days of about 135 to 140 days were more representative than FY26's 334 days.
Grid curtailment was another factor affecting earnings. CleanMax said Bikaner grid curtailment reduced H1 FY27 EBITDA by about 5%, such that EBITDA growth could have been 61% rather than the reported 56%. Curtailment declined from 70% in the first quarter to 44% in September and 26% in October as grid upgrades progressed, though management said the timing of final connectivity work remained outside its control.
Conclusion
CleanMax used a Rs 2,500 crore green bond to establish a majority fixed-rate debt mix while continuing to fund renewable capacity additions. The company paired 53.7% fixed-rate debt and an 8.3% corporate weighted average interest rate with 56% H1 FY27 EBITDA growth, although net debt rose to Rs 13,838 crore as construction spending continued.
Next, investors can watch delivery of the minimum 1,500-megawatt capacity-addition plan for the current fiscal year and progress toward management's minimum Rs 3,000 crore FY28 EBITDA expectation. The pace of Bikaner grid improvement after October's 26% curtailment level, final connectivity timing and changes in borrowing rates will help determine how the debt profile develops.