










Foreign Portfolio Investors Set Record ₹1.22 Lakh Crore Inflow
Key highlights
- The highest reported November 2026 FPI equity inflow was ₹1.22 lakh crore through November 20.
- Cited NSDL-NSE data placed November FPI buying at ₹1,12,095.78 crore.
- FPIs bought about ₹32,646.67 crore during all five sessions of the week ended November 20.
- Financial services received the largest reported sectoral FPI allocation of ₹43,102 crore.
powered by IRIS
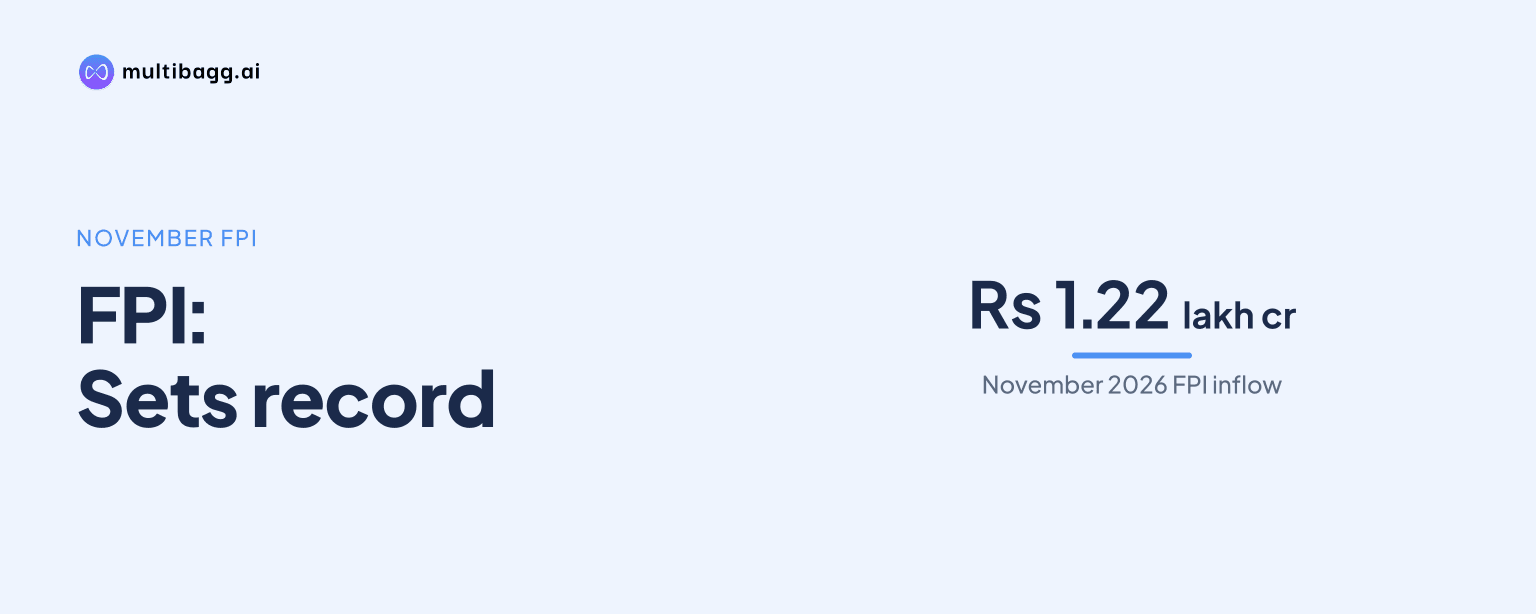
Foreign Portfolio Investors (FPIs) bought a reported ₹1.22 lakh crore of Indian equities between November 2 and November 20, 2026, the highest monthly inflow on record in the cited National Securities Depository data. The buying helped Indian benchmarks gain despite weakness in global technology stocks, though reported flow totals differ by data source and cut-off date.
How much did FPIs invest in Indian equities in November 2026?
FPIs invested a reported ₹1.22 lakh crore in Indian equities through November 20, according to the highest figure cited in the market discussion. This comfortably exceeded the prior monthly record of ₹70,896 crore, set in November 2020, and marked a sharp reversal after an extended period of foreign selling.
The available updates do not present one identical November total. Provisional exchange data put net purchases at ₹1,01,640.72 crore between November 2 and 19, while cited NSDL and NSE data placed the total at ₹1,12,095.78 crore. Other updates put the inflow near ₹1.12 lakh crore or ₹1,11,950 crore. The variation appears to reflect different data sets and reporting cut-offs, rather than a disagreement about the direction of flows.
Why did foreign flows reverse in November?
FPIs reversed course in November after six consecutive months of net selling from May through October, according to the cited updates. The discussion linked the shift to lower crude prices, improving earnings, rupee resilience and a reassessment of AI-linked market exposure, but it did not quantify the contribution of any individual factor.
The scale of buying also reversed much of the immediate selling seen before November. FPIs had sold about ₹70,704 crore during September and October combined, while the November inflow surpassed that amount. Even so, the move did not eliminate the broader withdrawal during 2026. The cited estimates show the year-to-date FPI net outflow falling from nearly ₹3 lakh crore to around ₹1.8 lakh crore after November's purchases.
Which sessions showed the strongest FPI buying?
FPIs were net buyers in all five trading sessions of the week ended November 20, purchasing about ₹32,646.67 crore on a net basis. Their largest reported purchase of that week was ₹10,308.42 crore on November 20, while provisional data for November 2 to 19 showed buying in all 13 regular trading sessions.
One cited provisional data set recorded the highest single-day purchase at ₹14,974.68 crore on November 5. Strong activity was also reported on the Thursday and Friday of the week ended November 20, when FPIs bought around ₹17,720 crore against domestic institutional investor, or DII, selling of approximately ₹6,216 crore. Total net institutional buying for that week was reported at about ₹19,900 crore.
Got a follow-up? Ask IRIS
Which sectors received the most foreign investor money?
Financial services received the largest reported sectoral FPI allocation, at ₹43,102 crore. Telecom attracted ₹7,570 crore, auto received ₹7,551 crore, consumer services drew ₹6,519 crore and information technology recorded ₹5,080 crore, based on the sector figures cited in the discussion.
The sector data indicates that the reported inflow was not limited to technology stocks, even as global technology shares faced uncertainty. Financial services accounted for the largest disclosed allocation by a wide margin. However, the context does not provide a complete sector-by-sector breakdown, company-level buying data or the valuation basis for these investment decisions.
How did India compare with other emerging markets?
India emerged as the largest recipient of foreign equity inflows among emerging markets in the reported November period, receiving around $10 billion in one Bloomberg-based comparison. In the same cited data, Taiwan saw nearly $21 billion of withdrawals and South Korea recorded $9.3 billion of outflows.
This comparison highlights a relative shift in foreign allocations towards India during the month, but it does not establish that the flows will continue at the same pace. The reported $10 billion figure also sits alongside rupee-denominated estimates that vary by source and date. Investors should therefore distinguish between the broad trend of strong buying and the precise monthly tally published by individual data providers.
Conclusion
November's reported FPI purchases represent a decisive break from the selling pattern that preceded them. Whether measured at ₹1,01,640.72 crore in provisional exchange data, ₹1,12,095.78 crore in cited NSDL-NSE data or ₹1.22 lakh crore in the highest NSDL-based figure, the inflow exceeded the previous monthly record and supported Indian equities during a period of global technology-stock weakness.
The next issue is whether the buying continues after the reported four-week streak. The cited context identifies global AI uncertainty, interest-rate risks, inflation and corporate earnings as factors that could influence flows, while the remaining 2026 net FPI outflow of around ₹1.8 lakh crore shows that November has not fully offset earlier withdrawals.