










Nifty Bank's 74.08% Five-Year Gain Needs Global Context
Key highlights
- Nifty Bank recorded a 74.08% five-year price return as of November 20, 2026.
- A separate supplied table showed Nifty Bank's five-year return at 70.2%, versus 45.23% for the Nifty 50.
- The cited five-year US-dollar figures put the Nasdaq 100 at 17.3% annualised and the S&P 500 at 12.6%.
- The supplied data contains no matched five-year global return series that can prove Nifty Bank outperformed the Nasdaq 100, S&P 500 or Kospi.
powered by IRIS
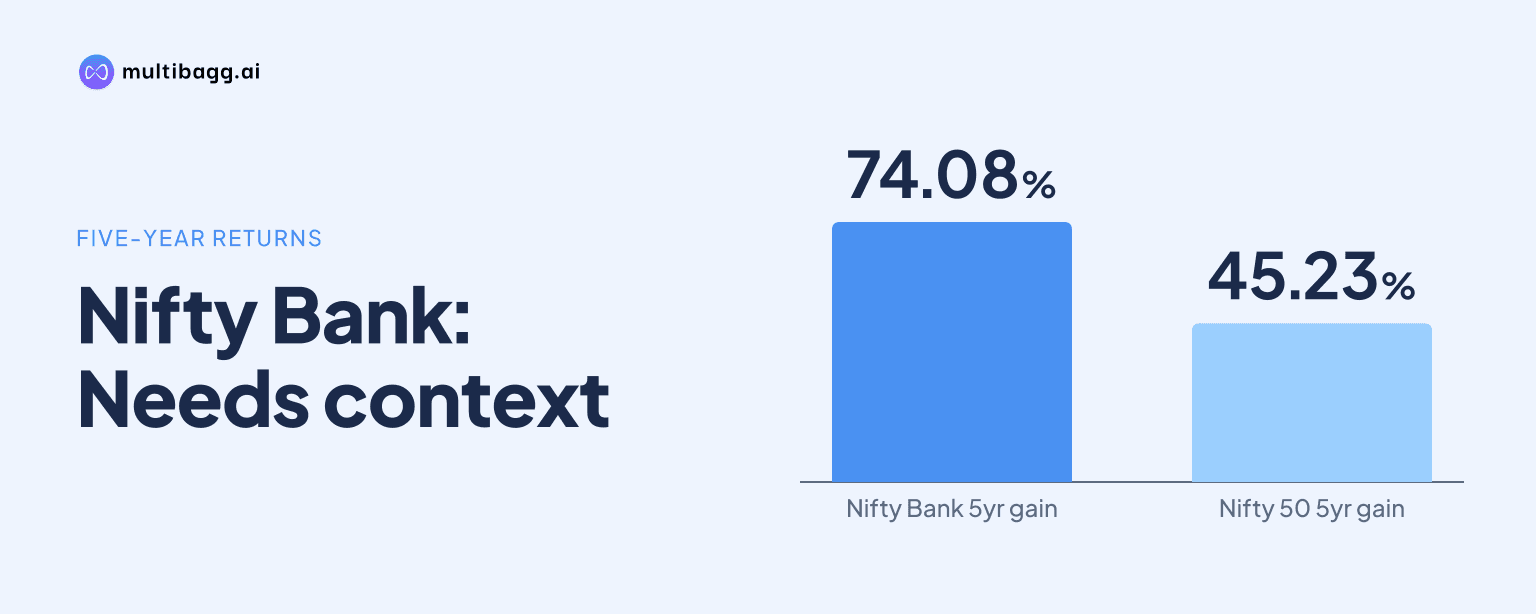
Nifty Bank recorded a 74.08% five-year price return as of November 20, 2026, but the supplied evidence does not establish that it beat the Nasdaq 100, S&P 500 or Kospi on a like-for-like basis. The global figures use different indices, currencies, return definitions and, in several cases, time windows.
What was Nifty Bank's five-year return?
Nifty Bank returned 74.08% over five years on a price-return basis as of 4:01 pm IST on November 20, 2026. This is an absolute return, not an annualised return, according to the supplied data. The same source reported a 9.86% one-year gain, while its five-year high and low were listed at 63,063 and 32,155.35 respectively.
Another supplied performance table shows a 70.2% five-year return for Nifty Bank, alongside a 48.3% three-year return and an 8.91% one-year return. The context does not explain the difference between the 70.2% and 74.08% five-year readings. Investors should therefore note the stated date, benchmark level and whether the data provider reports price return or total return before using either figure for comparisons.
Does the supplied data prove Nifty Bank beat global indices?
No, the supplied data does not prove that Nifty Bank outperformed the Nasdaq 100, S&P 500 or Kospi over five years. A valid comparison requires returns over identical beginning and ending dates, in the same currency, with the same treatment of dividends. The material provides a five-year return for Nifty Bank but does not provide a matched series for those global benchmarks.
The cited five-year US-dollar figures instead place the Nasdaq 100 at about 17.3% average annual returns, ahead of the S&P 500 at 12.6%, Germany at 9.8% and the stated Indian stock market figure at 9.5%. Those Indian-market data points are not stated as Nifty Bank returns. They therefore cannot be used to validate a claim about the banking index's relative global performance.
Got a follow-up? Ask IRIS
How did Nifty Bank compare with domestic indices?
Nifty Bank outpaced the Nifty 50 and Nifty 500 in the supplied five-year domestic comparison table. The bank index showed a 70.2% return, compared with 45.23% for the Nifty 50 and 57.42% for the Nifty 500. This makes the available domestic comparison clearer than the global claim.
The distinction matters because Nifty Bank is a sector-specific index, while the Nifty 50 and Nifty 500 represent broader parts of the Indian equity market. The Nifty 500 was also the subject of Motilal Oswal Asset Management Company's historical global study, not Nifty Bank. For the 10 years ended December 31, 2023, that study reported a 16.0% return for the Nifty 500, versus 21.5% for the Nasdaq 100 and 15.4% for the S&P 500.
Why do currency and return methodology change the result?
Currency and methodology can materially alter cross-market comparisons. A return earned in rupees can be lower when translated into US dollars if the rupee weakens against the dollar over the measurement period. Social-media discussions cited this issue as a reason that headline Indian-market gains may not equal dollar-based wealth creation for an overseas investor.
The supplied material also contains different return formats. One comparison lists a five-year Nifty 50 CAGR of 10.51% in rupees and 5.18% in US dollars, against 11.29% for the S&P 500 in US dollars. Other discussions use total return including dividends, while the 74.08% Nifty Bank figure is explicitly a price return. Such variations mean that a percentage alone is insufficient without its currency, dates and methodology.
Conclusion
Nifty Bank's reported five-year gain of 74.08% shows a strong price-return performance in the supplied November 2026 data, and the separate domestic table places it ahead of the Nifty 50 and Nifty 500 over five years. It does not, however, settle the claim that the index outperformed major global benchmarks because the required matched global return data are absent.
The next comparison to watch is a standardised five-year dataset that uses the same start and end dates, a common currency and either price return or total return for every index. Until that is available, the 17.3% annual US-dollar figure for the Nasdaq 100 and the 12.6% figure for the S&P 500 remain separate benchmark observations rather than direct verdicts on Nifty Bank.