










GRE margins fell as Rs 175 crore order pursued tender credentials
Key highlights
- GRE’s H1 FY27 EBITDA margin declined to 9.52% from 13.01% in H1 FY26.
- The Rs 175 crore utility-scale order contributed approximately 48% of GRE’s H1 FY27 revenue.
- GRE’s H1 FY27 revenue rose 217% year on year to Rs 139 crore, while PAT rose about 128% to Rs 9 crore.
- Solar EPC generated Rs 129 crore, or approximately 93%, of GRE’s H1 FY27 consolidated revenue.
powered by IRIS
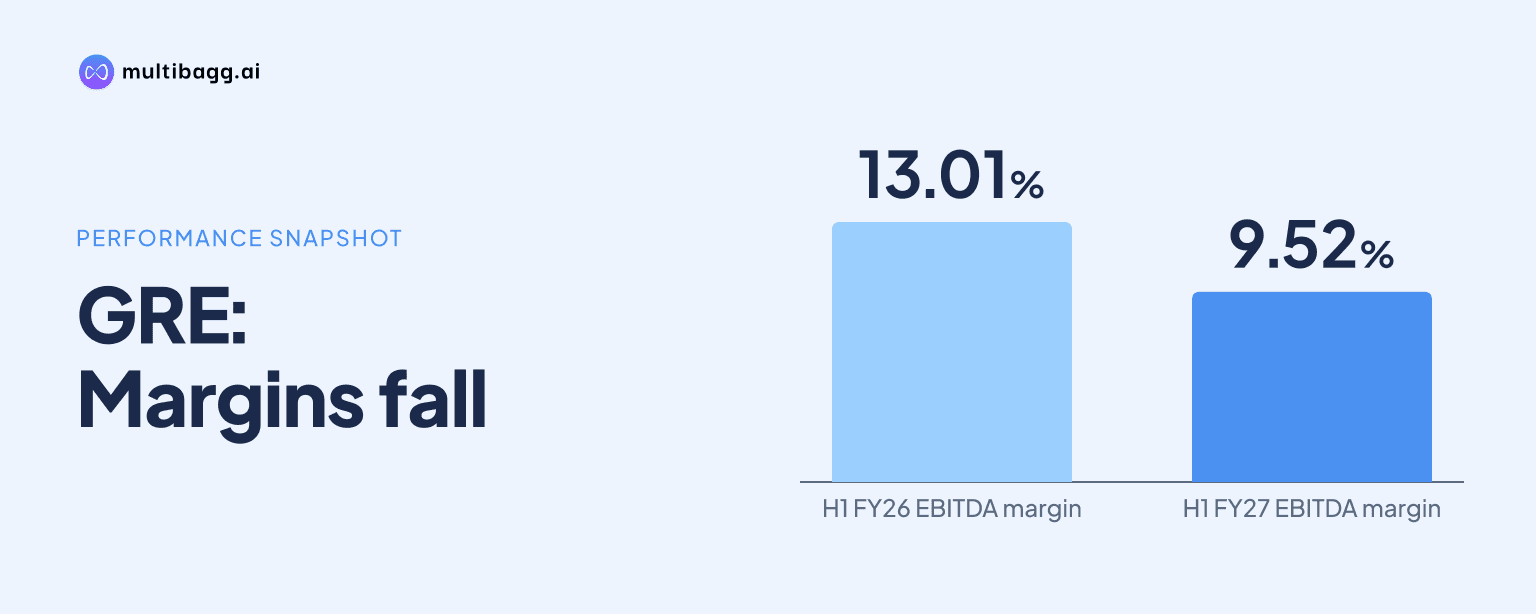
In H1 FY27, GRE Renewal Enertech Limited reported an earnings before interest, tax, depreciation and amortisation (EBITDA) margin of 9.52%, down from 13.01% a year earlier, because a Rs 175 crore 50 megawatt (MW) utility-scale order contributed about 48% of revenue at a lower margin. Management said it accepted the work to build tender-execution credentials.
Know GRE Renew Enertech inside out
Results, valuation, peers and who's buying, in one view.
Why did GRE’s margin decline in H1 FY27?
GRE’s margin declined because of a lower-margin, back-to-back engineering, procurement and construction (EPC) contract. Management said the 50 MW alternating-current (AC) and 65 MW direct-current (DC) project came through a fourth-layer subcontracting arrangement under a MAHAGENCO tender, leaving GRE with a smaller margin than it expects from direct tender participation.
The effect was visible even as absolute earnings increased. Consolidated revenue from operations rose 217% year on year to Rs 139 crore in H1 FY27 from Rs 44 crore in H1 FY26, while EBITDA increased 132% to Rs 13 crore from Rs 6 crore. EBITDA margin nevertheless declined by 3.49 percentage points to 9.52% because the utility-scale order represented approximately 48% of first-half revenue.
Profit after tax (PAT) rose about 128% to Rs 9 crore in H1 FY27 from Rs 4 crore a year earlier, but PAT margin declined to 6.56% from 9.13%. Management attributed the movement in both EBITDA and PAT margins to the specific 50 MW AC and 65 MW DC contract, rather than identifying a broader change in its solar EPC operating model.
What does GRE’s Rs 175 crore utility-scale order include?
GRE’s Rs 175 crore order comprises approximately Rs 170 crore of solar project work and Rs 5 crore of operation and maintenance (O&M) work for three years. Management said the project is at a single location and uses a standalone system, rather than GRE’s tracker-based solar technology.
The order mattered because solar EPC generated Rs 129 crore, or approximately 93%, of GRE’s Rs 139 crore consolidated revenue in H1 FY27. Solar EPC revenue was Rs 39 crore in H1 FY26, representing growth of approximately 228%, so the pricing and execution terms of one large EPC contract had a material effect on the consolidated margin.
Management said three companies were ahead of GRE in the project’s contracting chain, which reduced the margin available to the company. GRE did not disclose the specific contract margin or the margins earned by other parties. Its stated rationale was that completion would provide the utility-scale execution record needed for future tender qualifications.
How long does GRE expect margin pressure to continue?
Management said pressure on overall margins from the 50 MW project would continue until its execution is completed in H2 FY27 and H1 FY28. It described the decline as temporary and project-specific, but did not provide an EBITDA-margin target or quantify the remaining revenue and profit to be recognised from the contract.
GRE said new projects were being taken at margins it intends to maintain, although it did not give a numerical benchmark. The disclosed basis for a change in consolidated margins is therefore completion of the Rs 175 crore project, rather than a formal profitability forecast for FY28.
Revenue in H1 FY27 was also 75% above H2 FY26, indicating that growth was not limited to the year-on-year comparison. However, the mix changed as the large EPC order became nearly half of sales, while revenue from power sales under the renewable energy service company (RESCO) model was Rs 3.33 crore. Management said RESCO arrangements can provide revenue for up to 25 years, unlike EPC revenue linked to project delivery.
Got a follow-up? Ask IRIS
What tender credentials does GRE expect to gain?
GRE expects completing the 50 MW AC and 65 MW DC project to improve its eligibility to bid for larger tenders directly. Management said its earlier work had largely involved smaller projects, limiting its ability to participate in larger tenders, and it expects the new execution record to address that constraint.
Management said a future direct lowest-bidder, or L1, position could carry higher margins than a fourth-layer subcontract, but this was an expectation rather than guidance. As of September 30, GRE reported a total order book of Rs 229 crore and a completed-plus-ongoing portfolio of around 197 MW, showing that the credential-building order forms part of a wider EPC pipeline.
GRE’s independent power producer (IPP) portfolio also includes a 3 MW Solar Energy Corporation of India rooftop portfolio with a Rs 5 power purchase agreement, a 500-kilowatt third-party project and a 300-kilowatt project. Management said it was also developing an approximately 10.5 MW IPP project and expected total IPP capacity to reach roughly 25 MW to 26 MW after projects under way are commissioned.
How is GRE funding project execution and RESCO assets?
GRE said it had used Rs 39.56 crore of initial public offering proceeds by September 30, 2026, including Rs 29.85 crore for the Himmat Nagar solar project supporting its RESCO portfolio. During H1 FY27, it also raised Rs 8.50 crore through unsecured loans, increased its cash credit limit to Rs 5 crore and secured a Rs 2.58 crore term loan for the Rashtrapati Bhawan project.
Management said RESCO projects are generally funded with 25% from the company’s own funds and 75% from bank finance. It said debt would rise as the RESCO portfolio expands. For FY27, GRE cited 15 MW to 16 MW of running IPP projects and capital work in progress of almost 10 MW to 11 MW, while declining to provide capacity targets for FY28 or FY29.
Working-capital requirements also rose with the 65 MW project. An analyst cited trade receivables of Rs 80 crore, compared with Rs 10 crore previously, and receivable days of 106 days. Management said trade payables had risen alongside receivables for the specific project and that netting the two would not have a major net-working-capital effect.
Conclusion
GRE’s H1 FY27 results show the trade-off from its utility-scale strategy: revenue reached Rs 139 crore and PAT reached Rs 9 crore, but the Rs 175 crore back-to-back project reduced EBITDA margin to 9.52%. The company accepted the lower margin to build a 50 MW AC and 65 MW DC execution credential, while solar EPC supplied Rs 129 crore, or 93%, of first-half revenue.
The next items to watch are execution of the project through H2 FY27 and H1 FY28, the period management identified for margin pressure, and conversion of the Rs 229 crore order book. Management said it expects 70% to 80% of the EPC order book to convert in H2 FY27, while RESCO expansion would require funding under its stated 25:75 own-funds-and-bank-finance structure.