










Kratikal lifts revenue per client to Rs 5.1 lakh in H1 FY27
Key highlights
- Kratikal reported revenue per client of Rs 5.1 lakh in H1 FY27, up 1.8 times from Rs 2.84 lakh in H1 FY26.
- Recurring revenue represented 72.3% of H1 FY27 revenue, compared with 71.5% in H1 FY26.
- Existing customers supplied 48% of H1 FY27 revenue, up from 36% a year earlier.
- Kratikal's top 10 customers accounted for 31.5% of H1 FY27 revenue.
powered by IRIS
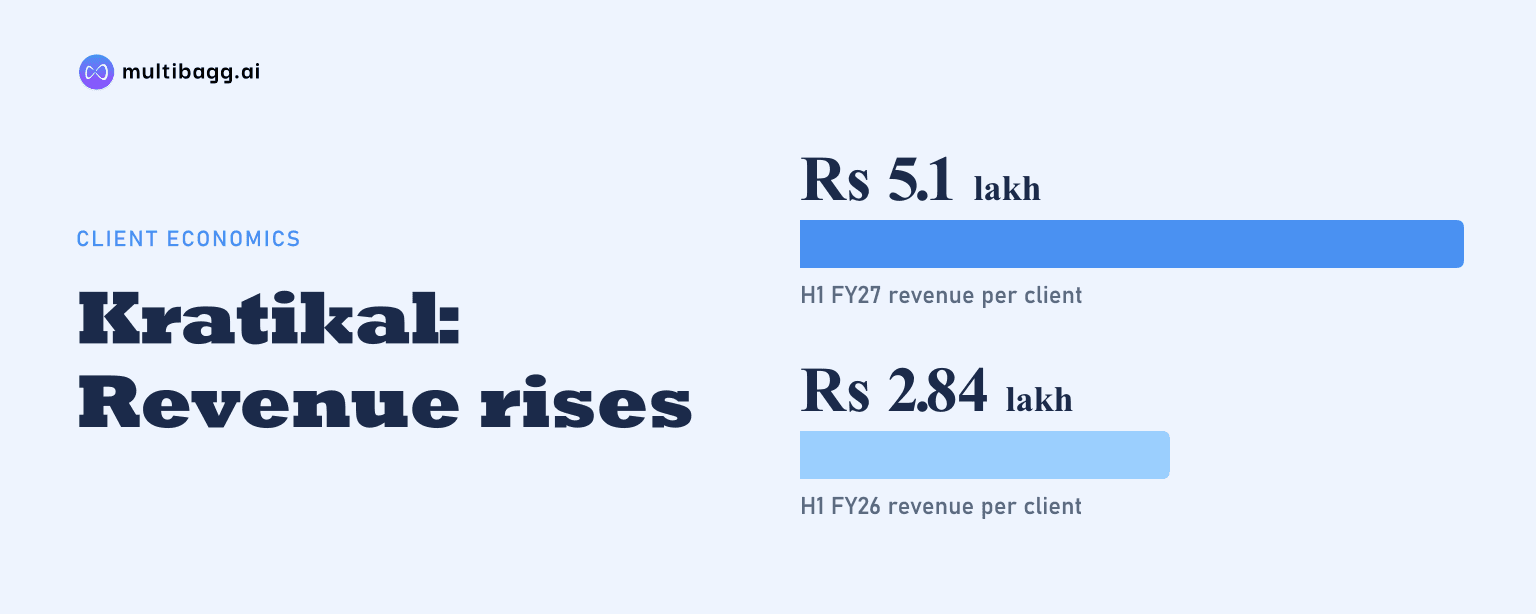
Kratikal reported revenue per client of Rs 5.1 lakh in H1 FY27, 1.8 times the Rs 2.84 lakh in H1 FY26, while recurring revenue increased to 72.3% from 71.5%. The higher customer monetisation coincided with revenue from operations rising 65.2% year on year to Rs 22.32 crore.
Know Kratikal Tech inside out
Results, valuation, peers and who's buying, in one view.
How much did Kratikal's revenue per client increase in H1 FY27?
Kratikal's revenue per client rose to Rs 5.1 lakh in H1 FY27 from Rs 2.84 lakh in H1 FY26, a 1.8-times increase according to the presentation. Kratikal served 438 clients in the six-month H1 FY27 period, while it served 677 clients in FY26 and 638 in FY25. As the latter two figures are full-year measures, they are not directly comparable with the H1 FY27 client count.
Revenue from operations increased by Rs 8.81 crore to Rs 22.32 crore in H1 FY27 from Rs 13.51 crore in H1 FY26. Earnings before interest, tax, depreciation and amortisation, or EBITDA, increased to Rs 4.09 crore from Rs 1.79 crore, and the EBITDA margin rose to 18.3% from 13.3%. Profit after tax increased to Rs 2.80 crore from Rs 1.22 crore, with its margin rising to 12.5% from 9.0%.
How recurring was Kratikal's H1 FY27 revenue?
Kratikal classified 72.3% of H1 FY27 revenue as recurring, compared with 71.5% in H1 FY26, an increase of 0.8 percentage points. One-time revenue was therefore 27.7% in H1 FY27, down from 28.5% a year earlier. The presentation does not provide contract durations or a further breakdown of the recurring-revenue category.
Existing customers accounted for 48% of H1 FY27 revenue, up from 36% in H1 FY26, while new customers accounted for 52%, down from 64%. This changed the half-year revenue mix towards existing accounts by 12 percentage points. The disclosed recurring share and existing-customer share are separate measures, but both increased during the period.
Returning customers generated Rs 16.8 crore, or 60%, of H1 FY27 bookings, while new customers generated Rs 11.0 crore from 225 accounts. These are booking figures rather than revenue-recognition figures. Together, they indicate that Kratikal's H1 FY27 commercial activity included both repeat demand and customer acquisition.
Which Kratikal offerings had higher ticket sizes?
Kratikal's Threatcop average ticket size increased 34% to Rs 6.37 lakh in H1 FY27 from Rs 4.76 lakh in H1 FY26. Kratikal services recorded an average ticket size of Rs 3.20 lakh, up 10% from Rs 2.91 lakh. Threatcop's H1 FY27 ticket was Rs 3.17 lakh higher than the Kratikal services ticket.
Threatcop's revenue share increased over the FY24-to-FY26 period, reaching 54% in FY26 from 49% in FY24 and 52% in FY25. Its share was 52% in H1 FY27, while Kratikal services represented 48%, compared with 46% in FY26. The half-year mix therefore moved 2 percentage points back towards Kratikal services from the FY26 split.
Cross-sell bookings rose to Rs 2.22 crore in H1 FY27 from Rs 66.9 lakh in H1 FY26, a 3.3-times increase. Kratikal services cross-sell bookings increased to Rs 1.88 crore from Rs 59.6 lakh, while Threatcop cross-sell bookings grew to Rs 34.1 lakh from Rs 7.3 lakh. The source identifies these amounts as bookings, not revenue.
Got a follow-up? Ask IRIS
How concentrated was Kratikal's customer revenue in H1 FY27?
Kratikal's top 10 customers accounted for 31.5% of H1 FY27 revenue, almost unchanged from 31.6% in FY26 and above 21.9% in FY25. The top-five share was 20.0% in H1 FY27, compared with 21.2% in FY26 and 15.9% in FY25. These figures show that the top-10 concentration level remained broadly stable against FY26.
The largest single customer represented 5.5% of H1 FY27 revenue, compared with 8.9% in FY26 and 5.1% in FY25. The largest-account share was therefore lower than the FY26 level, even though the top-10 share was largely unchanged. Kratikal does not identify those customers or disclose their contract timing or terms.
Kratikal reported 494 accounts, up from 324 in its cited comparison, and said United States orders rose to 15 from three. International bookings reached Rs 8.2 crore, representing 30% of bookings, while Middle East bookings were Rs 5.1 crore. The Middle East activity covered government, healthcare and logistics sectors, according to the presentation.
What does Kratikal's cost and investment position show?
Kratikal's employee cost was 40% of revenue in H1 FY27, compared with 41% in FY26 and 48% in FY25. Employee benefits expense nevertheless rose 39.9% year on year to Rs 8.98 crore from Rs 6.42 crore. This expense growth was below the 65.2% increase in H1 FY27 revenue from operations.
Reported H1 FY27 EBITDA was Rs 4.09 crore after Rs 97 lakh of growth spending, compared with EBITDA before growth spending of Rs 5.06 crore. The disclosed spending included Rs 65 lakh for a United States entity, Rs 34 lakh for a Dubai entity, two sales hires that brought the team to four, and a new Nepal market. Kratikal reported a 22.7% margin before this growth spend and an 18.3% reported margin.
Kratikal raised Rs 39.7 crore through 29.4 lakh shares at Rs 135 and listed on BSE SME on 7 July 2026. Of the proceeds, Rs 23.1 crore was allocated to United States and UAE subsidiaries and Rs 9.2 crore to product development, including 49 hires for AutoGRC and the Threatcop email gateway. At 30 September 2026, Rs 35.44 crore remained unutilised in fixed deposits and escrow, while Rs 4.25 crore had been spent on issue expenses.
Conclusion
Kratikal's H1 FY27 disclosures show higher revenue per client alongside a recurring-revenue share above 72%. The customer mix shifted towards existing customers, which supplied 48% of revenue, while Threatcop recorded the larger average ticket at Rs 6.37 lakh. At the same time, the top 10 customers accounted for 31.5% of revenue, making concentration relevant to the customer-economics picture.
The next reported indicators to watch are deployment of the Rs 23.1 crore allocated to United States and UAE subsidiaries and the Rs 9.2 crore earmarked for product development. At 30 September 2026, Rs 35.44 crore of the Rs 39.7 crore raised had not been utilised. Future disclosures can indicate whether these plans affect client additions, ticket sizes, recurring revenue and customer concentration.