










Neuland CMS top five customers made up 96% of revenue
Key highlights
- Neuland’s top five CMS customers accounted for 96% of Q2FY27 CMS revenue.
- Commercial CMS revenue fell by Rs 204 crore to Rs 214 crore in Q2FY27 from Rs 418 crore in Q1FY27.
- CMS represented 53% of Neuland’s Q2FY27 segment revenue, down from 67% in Q1FY27.
- Neuland had 99 active CMS projects in Q2FY27, including 19 commercial projects.
powered by IRIS
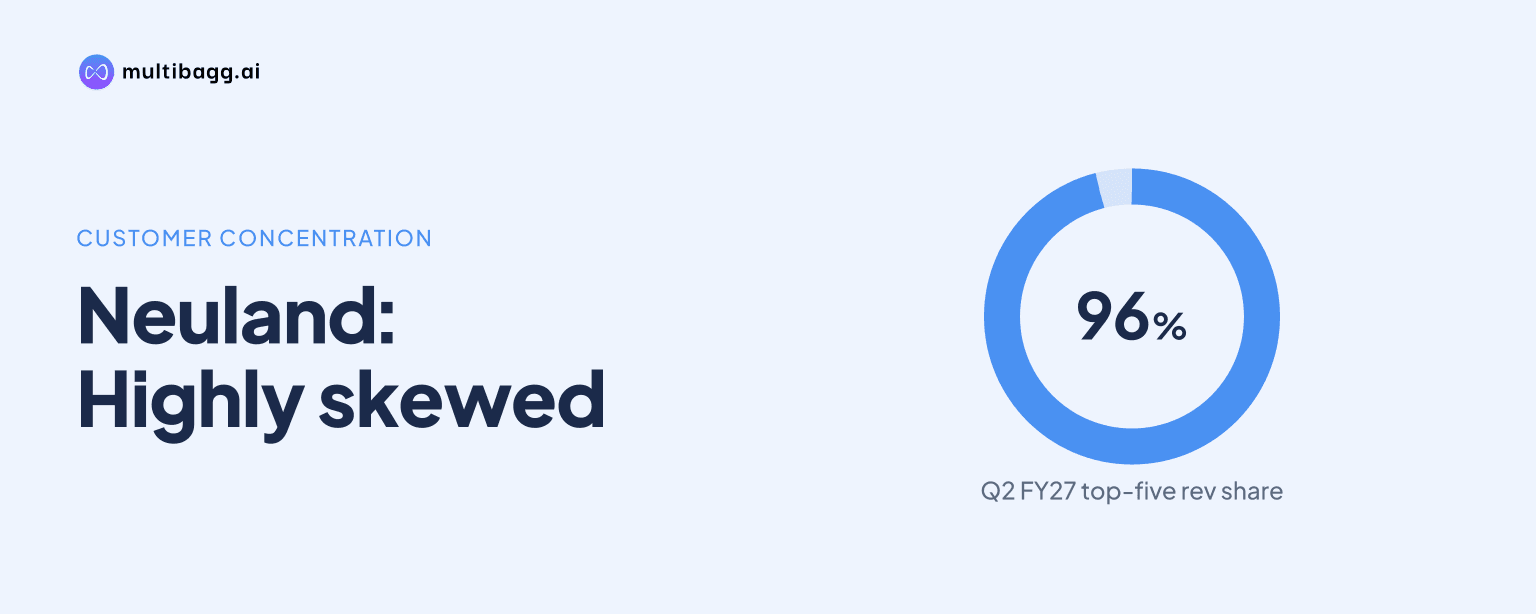
Neuland reported that its top five customers generated 96% of CMS revenue in Q2FY27, while commercial CMS revenue fell to Rs 214 crore from Rs 418 crore in Q1FY27. CMS accounted for 53% of segment revenue, down from 67% in the preceding quarter, as development revenue rose from Rs 20 crore to Rs 32 crore.
Know Neuland Laboratories inside out
Results, valuation, peers and who's buying, in one view.
Why was Neuland CMS revenue concentrated in Q2FY27?
Neuland’s CMS business generated 96% of its Q2FY27 revenue from its five largest customers and 99% from its 10 largest customers. Product concentration was similarly high: the top five CMS products accounted for 94% of segment revenue and the top 10 products accounted for 99%.
CMS was more concentrated than Neuland’s overall business, where the top five customers contributed 63% of revenue and the top 10 contributed 82%. The comparable top-five customer contribution was 83% for Prime and 62% for Specialty, while the top-10 figures were 98% for Prime and 81% for Specialty.
Neuland attributes CMS customer concentration to its work with innovator customers on an exclusive basis. The segment develops and manufactures active pharmaceutical ingredients, or APIs, and intermediates to customer requirements; the company says this exclusive model makes the business highly concentrated by customer.
The mix of Neuland’s segment revenue changed in Q2FY27. CMS represented 53%, compared with 67% in Q1FY27 and 68% in Q4FY26, while Prime rose to 30% from 18% in Q1FY27. Specialty represented 10% in Q2FY27 versus 8% in Q1FY27, and Others accounted for 8% versus 6%.
How did Neuland CMS revenue change in Q2FY27?
Neuland’s CMS revenue, based on the disclosed quarterly development and commercial split, declined to Rs 246 crore in Q2FY27 from Rs 438 crore in Q1FY27. Commercial revenue fell by Rs 204 crore to Rs 214 crore, while development revenue increased by Rs 12 crore to Rs 32 crore.
Commercial CMS revenue in Q2FY27 was also below the Rs 291 crore reported for Q2FY26. Development revenue moved in the opposite direction, rising to Rs 32 crore from Rs 19 crore a year earlier, but the increase was smaller than the reduction in commercial manufacturing revenue.
The quarterly sequence shows the scale of variation in commercial CMS sales: Rs 291 crore in Q2FY26, Rs 247 crore in Q3FY26, Rs 488 crore in Q4FY26, Rs 418 crore in Q1FY27 and Rs 214 crore in Q2FY27. Development revenue across the same five quarters was Rs 19 crore, Rs 23 crore, Rs 43 crore, Rs 20 crore and Rs 32 crore, respectively.
Got a follow-up? Ask IRIS
What did Neuland report for CMS revenue in H1FY27?
Neuland’s H1FY27 CMS revenue-split presentation lists development revenue of Rs 639 crore and commercial revenue of Rs 41 crore, compared with Rs 411 crore and Rs 32 crore, respectively, in H1FY26. On those reported labels, the H1FY27 total is Rs 680 crore, compared with Rs 443 crore in H1FY26.
The H1FY27 table’s development figure is Rs 228 crore above H1FY26, while its commercial figure is Rs 9 crore higher. These labels differ from the aggregate of the separately disclosed Q1FY27 and Q2FY27 quarterly figures, which total Rs 52 crore for development and Rs 632 crore for commercial revenue; Neuland’s presentation does not explain the difference.
At the company level, Neuland reported total income of Rs 457.2 crore in Q2FY27, versus Rs 650.1 crore in Q1FY27. Earnings before interest, tax, depreciation and amortisation, or EBITDA, fell to Rs 104.6 crore from Rs 231.1 crore, and the EBITDA margin declined to 22.9% from 35.5%.
For H1FY27, total income was Rs 1,107.2 crore, up 35.6% year on year, while EBITDA was Rs 335.6 crore, up 68.6%. Profit after tax was Rs 198.5 crore, up 80.2% from H1FY26, although the CMS half-year revenue categories require clarification against the quarterly split.
How many CMS projects were active in Q2FY27?
Neuland had 99 active CMS projects in Q2FY27, compared with 98 in Q2FY26 and 97 in Q2FY25. The Q2FY27 portfolio comprised 59 API projects and 40 intermediate projects, with 19 commercial projects in total.
The commercial count included nine API projects and 10 intermediate projects in Q2FY27. It was one project higher than the Q2FY26 commercial count of 18 and matched the 19 commercial projects reported in Q2FY25.
Neuland defines pre-clinical through Phase 3 projects as process research and development plus manufacturing quantities for clinical trials. It defines pre-registration or registration work as Phase 3-complete molecules that have been filed but are not yet commercial, or molecules where a customer is adding Neuland as a second source.
The largest year-on-year stage movement was in Phase 3, where the active count increased to 13 in Q2FY27 from eight in Q2FY26. The 17 pre-clinical projects, 23 Phase 1 projects, 20 Phase 2 projects, 13 Phase 3 projects and seven pre-registration or registration projects together represented 80 of the 99 active projects.
Conclusion
Neuland’s Q2FY27 CMS disclosures show that the segment depended heavily on a small customer group, with five customers accounting for 96% of revenue and 10 accounting for 99%. At the same time, commercial revenue declined by Rs 204 crore quarter on quarter, reducing CMS’s share of Neuland’s segment revenue to 53% from 67%.
The next items to watch are changes in the 99-project portfolio, particularly the 13 Phase 3, seven pre-registration or registration and 19 commercial projects. Neuland also needs to clarify the difference between its H1FY27 revenue-split labels of Rs 639 crore development and Rs 41 crore commercial revenue and the sums implied by its quarterly CMS disclosures.