










National Stock Exchange Breadth Reaches 53.5% Above 200-Day EMA
Key highlights
- On November 12, 53.5% of 1,514 liquid NSE stocks closed above their 200-day averages.
- One NSE session recorded 1,959 declines versus 1,629 advances among 3,698 traded stocks.
- India VIX rose to about 17.4 on November 9 from 10.345 on September 23, an increase of about 68% in 47 calendar days.
- A cited Nifty update said the index gained 149 points during a five-session rally and crossed the 200-day EMA near 23,900.
powered by IRIS
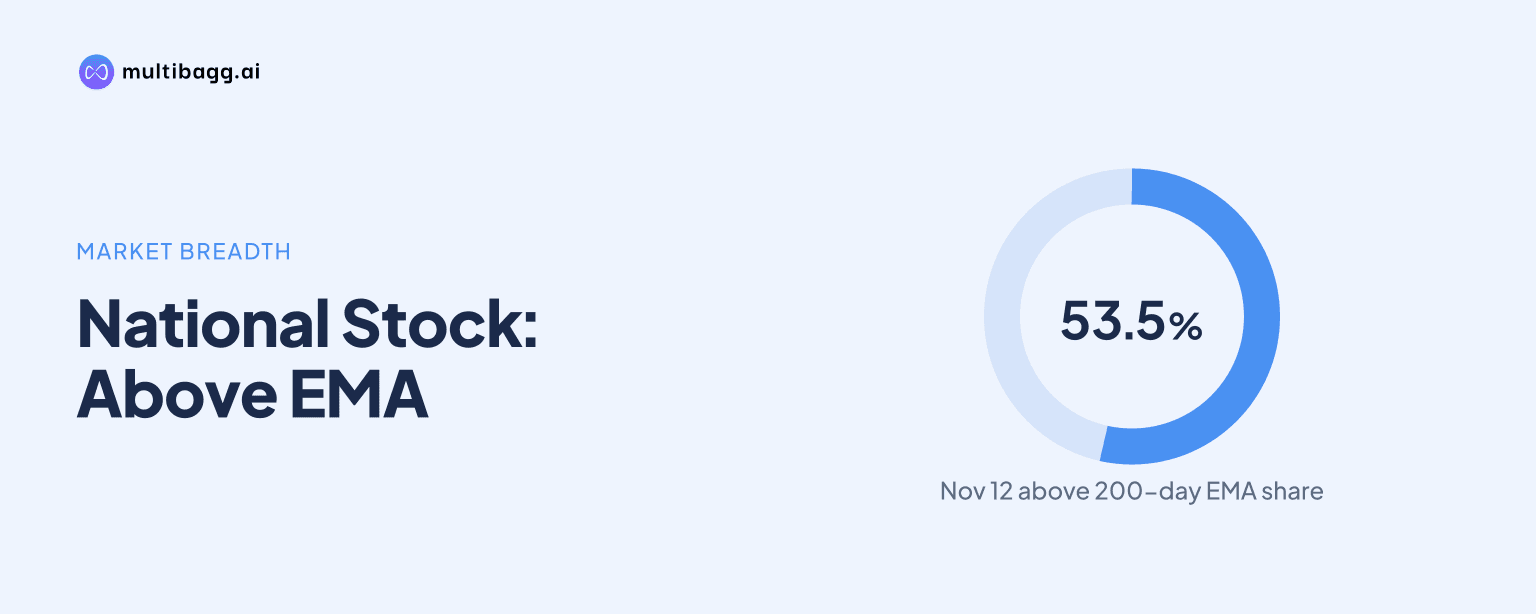
National Stock Exchange breadth improved on November 12, 2026, with 53.5% of 1,514 liquid stocks closing above their 200-day averages, indicating better long-term participation after uneven market leadership. The reading supports a recovery case, but sessions with more declines than advances show that the improvement is not yet uniform.
What does the 53.5% NSE breadth reading show?
The 53.5% reading shows that slightly more than half of the liquid NSE stocks tracked were trading above their long-term 200-day average on November 12. It is a measure of internal market participation rather than a reading on the direction of a market-cap weighted index alone.
The cited breadth framework uses the 1,000 most-traded NSE stocks each month, while the November 12 reading covered 1,514 liquid stocks. A larger proportion of stocks above their long-term average can indicate that gains are spreading beyond a limited group of heavyweight shares. That matters when index performance has at times been concentrated in fewer stocks.
Why is NSE participation still considered uneven?
NSE participation is still considered uneven because one cited session recorded 1,959 decliners against 1,629 advancers among 3,698 traded stocks. This shows that a constructive long-term breadth reading can coexist with short-term selling across a larger number of shares.
The available discussion also notes intermittent widespread buying, stronger Nifty 500 performance and constructive CNX500 trend signals. These factors support the recovery argument, but they do not remove the risk of narrow leadership. The rise in India VIX to about 17.4 on November 9, from 10.345 on September 23, also points to a more volatile market setting.
How do the NSE 10-day and 200-day EMAs differ?
The NSE 10-day EMA tracks recent price action more closely, while the 200-day EMA is used as a longer-term trend reference. An exponential moving average gives greater weight to recent prices, making it more responsive than a simple moving average, which applies equal weighting across the chosen period.
The technical screener described in the discussion identifies stocks whose 10-day EMA crossed above the 200-day EMA within the past five trading days. This is an event-detection rule, not a forecast of future returns. A price move above the 200-day EMA can suggest a possible change in long-term trend, but it does not establish that the move will continue.
Got a follow-up? Ask IRIS
What levels must the NSE index clear to strengthen the recovery?
The NSE index needs to sustain moves above its medium- and long-term moving averages to strengthen the broader recovery signal. In one assessment, the index had moved above its 10-day and 20-day EMAs, both trending upward, but remained below its 50-day and 200-day EMAs.
Another market update described Nifty closing 149 points higher during a five-session rally and moving above the 200-day EMA near 23,900. That assessment identified 24,300-24,400 as the next upside area to watch. A separate technical view placed Nifty near the 25,000 level and its 200-day EMA, with 25,100-25,000 described as immediate support and 25,500, coinciding with the 10-day EMA, as a level that needed to be sustained to limit renewed selling pressure.
Can a 200-day EMA breakout confirm an NSE market bottom?
A 200-day EMA breakout cannot by itself confirm an NSE market bottom or guarantee a near-term advance. Historical evidence covering 2015 to 2026 suggests that the breadth measure is more useful for assessing market risk than for predicting short-term direction.
Traders commonly view a close above the 200-day EMA as a sign that buyers may be regaining control, but confirmation requires more than one indicator. The discussion specifically notes that tools such as RSI or MACD can help assess whether a breakout has supporting momentum. Investors also need to watch whether breadth remains positive across subsequent sessions rather than relying on a single reading.
Conclusion
The National Stock Exchange reading of 53.5% of 1,514 liquid stocks above their 200-day averages points to improved internal market conditions. Combined with stronger buying in some midcap and smallcap sessions and a positive short-term Nifty trend, it supports a recovery narrative, but the higher number of decliners in another session confirms that participation remains inconsistent.
The next test is whether NSE breadth can remain above the halfway mark while the index holds key moving-average levels. Investors will also watch the stated Nifty zones near 23,900, 24,300-24,400, 25,000-25,100 and 25,500, as well as whether volatility stays elevated after India VIX rose about 68% in 47 calendar days.