










National Stock Exchange Market Breadth Recovery Reaches 53.5%
Key highlights
- On 12 November 2026, 53.5% of 1,514 liquid National Stock Exchange stocks closed above their 200-day averages.
- The Nifty 500 rose 9.5% over 21 sessions, while the analysis flagged narrowing breadth alongside the gain.
- On one National Stock Exchange session, 1,959 of 3,698 traded stocks declined versus 1,629 advances.
- The CNX500 levels highlighted for breadth were 9,185 on the 200-day average, 9,213 on the 50-week average and about 9,200 as a key zone.
powered by IRIS
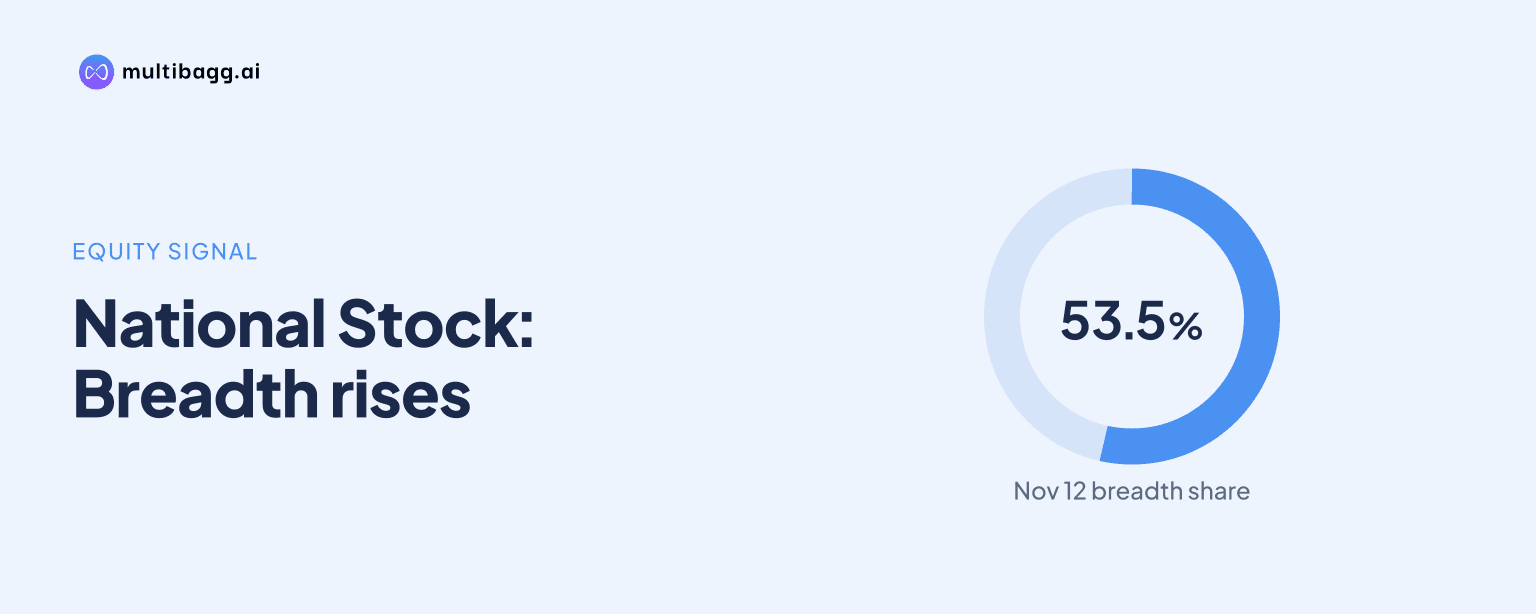
On 12 November 2026, National Stock Exchange market breadth showed 53.5% of 1,514 liquid stocks closing above their 200-day averages. The reading points to improving internal conditions after a period of uneven participation, but the available data also show that index gains have at times remained concentrated in fewer shares.
What does the 53.5% breadth reading show?
The 53.5% reading shows that slightly more than half of the liquid stocks tracked were trading above their long-term 200-day average on 12 November. Breadth measures participation across stocks rather than the movement of a market-cap weighted benchmark, using the 1,000 most-traded National Stock Exchange stocks each month in the cited framework. That gives mid-sized and small companies considerable influence over the measure.
The historical study covering 2015 to 2026 suggests this measure is more useful as an assessment of market risk than as a short-term directional forecast. When breadth has weakened or faded, subsequent falls in mid-sized and small companies have been deeper and breakouts have failed more often. At major market tops, breadth often peaked two to six months before the mid-sized and small-company indices, although it did not predict whether the market would rise or fall over the following few weeks.
Why have index gains and breadth not always matched?
Index gains and breadth can diverge because a weighted index can rise on the strength of a relatively small set of large stocks while many other shares decline. Over 21 sessions, the Nifty 500 gained 9.5%, but the cited analysis described narrowing participation alongside that advance. This is why a higher benchmark alone does not establish that the recovery is broad-based.
The daily snapshots illustrate the uneven pattern. On one reported session, 1,629 of 3,698 traded National Stock Exchange stocks advanced, while 1,959 declined and 110 were unchanged. By contrast, data through the close on 5 November showed 2,116 of 2,623 main-board stocks rising over four sessions, and 361 of the Nifty 500's 500 members advancing on that day. These figures show that participation has improved at points but has not been consistently strong.
Got a follow-up? Ask IRIS
Which CNX500 levels could affect breadth?
The CNX500 levels identified in the discussion are 9,185 for its 200-day moving average, 9,213 for its 50-week moving average, and roughly 9,200 as the key area to hold. The analysis said that staying above 9,200 would help prevent a fresh deterioration in breadth, while a break below it could reopen concerns about internal market participation.
The technical backdrop was described as constructive but not free of risk. The relative strength line had reversed its decline and moved above its 50-day moving average, while the CNX500 had moved above its 200-day average after a brief consolidation. However, the RSI and Stochastic were described as slightly overbought, which could lead to consolidation. The weekly MACD remained in buy mode and the PPO was positive, according to the cited chart analysis.
Does a breadth thrust strengthen the recovery case?
A breadth thrust would strengthen the case for broad participation, but the provided data do not establish a new thrust. Under Martin Zweig's definition, a thrust occurs when the 10-day average share of advancing stocks rises from below 40% to above 61.5% within two weeks. It is a rapid shift from a market dominated by declines to one supported by widespread advances.
The historical National Stock Exchange evidence makes the signal worth monitoring rather than treating it as a certainty. The context cites 13 thrusts since 6 October 1999, with average Nifty 500 returns of 18.4% over the following six months, compared with 8.3% for all six-month periods in the sample. It also notes the small sample size and multiple horizons tested. A separate reference describes 12 occurrences since 1999 and identifies 8 April 2026 as the latest, reinforcing the need to treat such counts cautiously.
Conclusion
The 53.5% reading above the 200-day average indicates that National Stock Exchange market breadth has improved, but the broader evidence remains mixed. Strong Nifty 500 performance, intermittent widespread buying and constructive CNX500 trend signals support the recovery case, while sessions with more decliners than advancers show that participation is still uneven.
The next test is whether the CNX500 can remain above the 9,200 area, with 9,185 and 9,213 also identified as important trend markers. Investors can also watch whether advances become consistently broader and whether the 10-day share of advancing stocks moves closer to breadth-thrust conditions, rather than relying on single-session readings.