










Ola Electric Q2 FY27 loss widens to Rs 362 crore on revenue fall
Key highlights
- Ola reported a Rs 362 crore consolidated PAT loss in Q2 FY27, versus Rs 336 crore in Q1 FY27.
- Ola's Q2 FY27 revenue from operations declined to Rs 421 crore from Rs 455 crore in Q1 FY27.
- Ola's adjusted operating EBITDA loss widened to Rs 246 crore from Rs 195 crore sequentially.
- Ola's consolidated free cash flow was negative Rs 371 crore in Q2 FY27, compared with negative Rs 351 crore in Q1 FY27.
powered by IRIS
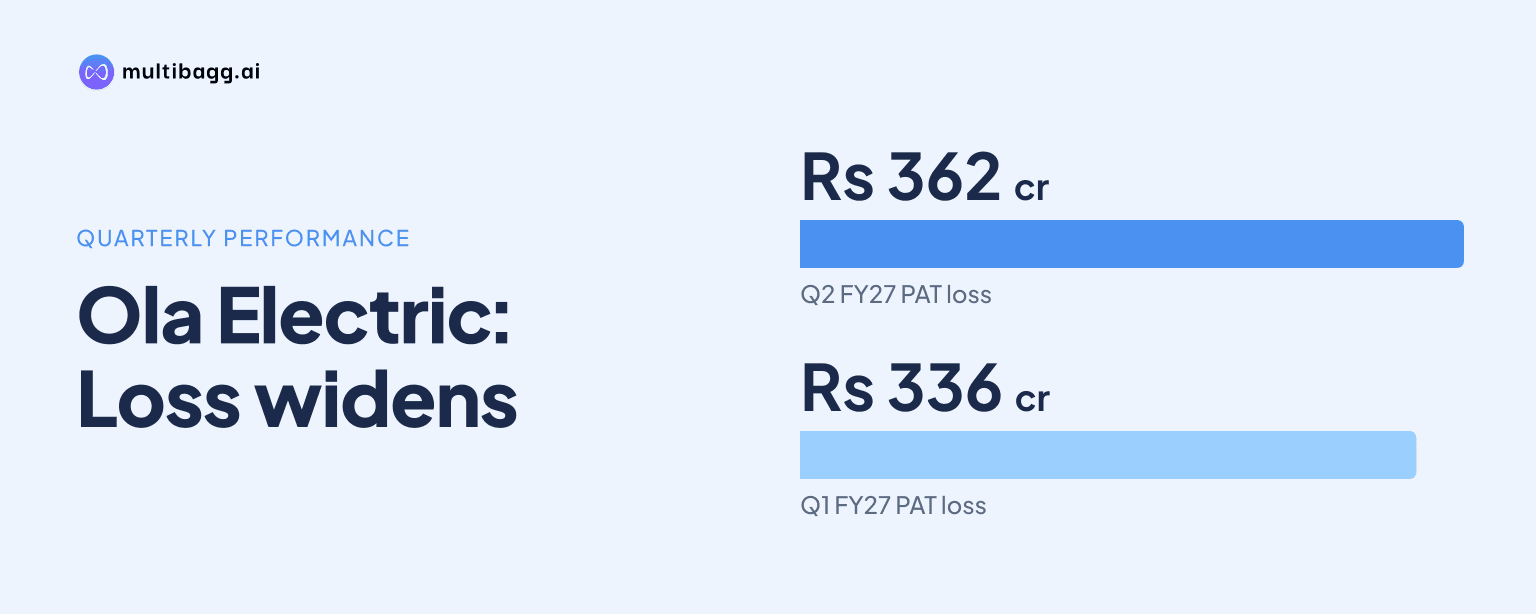
Ola Electric reported an unaudited consolidated loss of Rs 362 crore in Q2 FY27, Rs 26 crore wider than Q1 FY27, as revenue fell Rs 34 crore to Rs 421 crore and adjusted operating EBITDA loss increased Rs 51 crore to Rs 246 crore. Reported gross margin was 29.93%.
Know Ola Electric Mobility inside out
Results, valuation, peers and who's buying, in one view.
Why did Ola's Q2 FY27 loss widen?
Ola's Q2 FY27 consolidated loss widened because revenue and gross margin in rupee terms declined while operating expenses increased. Revenue from operations fell to Rs 421 crore from Rs 455 crore in Q1 FY27, while gross margin declined to Rs 126 crore from Rs 139 crore. Profit after tax, or PAT, was a loss of Rs 362 crore, compared with a Rs 336 crore loss in the preceding quarter.
Operating expenses, including lease expenses, rose to Rs 369 crore in Q2 FY27 from Rs 333 crore in Q1 FY27. Operating earnings before interest, tax, depreciation and amortisation, or operating EBITDA, consequently moved to a Rs 218 crore loss from a Rs 165 crore loss. Adjusted operating EBITDA, which excludes other income and includes lease expenses, recorded a Rs 246 crore loss versus Rs 195 crore.
The adjusted operating EBITDA margin deteriorated to negative 58.5% in Q2 FY27 from negative 42.8% in Q1 FY27. That change occurred alongside a 0.57-percentage-point reduction in reported gross margin, from 30.5% to 29.93%, and a Rs 36 crore increase in operating expenses.
How did Ola's revenue and gross margin change in Q2 FY27?
Ola's Q2 FY27 revenue declined sequentially while its reported consolidated gross margin remained near 30%. Revenue decreased 7.5% from Rs 455 crore in Q1 FY27 to Rs 421 crore, and gross margin fell Rs 13 crore to Rs 126 crore. Gross margin per unit was unchanged at Rs 35,000 in Q1 FY27 and Q2 FY27.
The financial table lists Q2 FY27 reported gross margin at 29.93%, compared with 30.5% in Q1 FY27. A separate graph shows gross margin at 29.3% in Q2 FY27, without explaining the difference from the financial table. Gross margin excluding production-linked incentive, or PLI, rose to 26.5% from 23.3% in Q1 FY27.
Average selling price rose to Rs 1.21 lakh per unit in Q2 FY27 from Rs 1.14 lakh in Q1 FY27, but remained below Rs 1.31 lakh in Q2 FY26. Industry electric two-wheeler volumes increased to 600,000 vehicles from 526,000 vehicles, while electric-vehicle penetration rose to 11.18% from 9.23%. The presentation does not provide Ola's vehicle sales volume or a revenue bridge for the Rs 34 crore decline.
Got a follow-up? Ask IRIS
What did Ola's Automotive and Cell segments contribute?
Ola's Automotive Segment generated Rs 420 crore of Q2 FY27 revenue, accounting for nearly all of the consolidated Rs 421 crore total, but its adjusted operating EBITDA loss increased. Automotive revenue fell from Rs 455 crore in Q1 FY27, while gross margin declined from Rs 139 crore to Rs 125 crore. Segment gross margin eased to 29.76% from 30.5%.
The Automotive Segment's adjusted operating EBITDA loss was Rs 145 crore in Q2 FY27, compared with Rs 141 crore in Q1 FY27, and its adjusted margin was negative 34.5% versus negative 31.0%. Its PAT loss narrowed to Rs 214 crore from Rs 233 crore, while free cash flow outflow increased to Rs 134 crore from Rs 123 crore.
The Cell Segment reported Rs 3 crore of revenue in Q2 FY27, down from Rs 5 crore in Q1 FY27, while gross margin increased to Rs 2 crore from Rs 1 crore. Cell operating expenses were Rs 40 crore after negative Rs 21 crore in Q1 FY27. The segment moved to a Rs 38 crore adjusted operating EBITDA loss from a Rs 22 crore profit and recorded a Rs 84 crore PAT loss, compared with Rs 28 crore.
What do Ola's cash flows and operating plans indicate?
Ola's cash flow from operations improved sequentially, but free cash flow outflow increased in Q2 FY27. Consolidated cash flow from operations was negative Rs 188 crore, compared with negative Rs 215 crore in Q1 FY27. Free cash flow was negative Rs 371 crore after negative Rs 351 crore, an increase of Rs 20 crore in the outflow.
Management said most company stores have been shut and new production is going to dealers, with dealer-channel inventory at about 15 days. It expects production of about 25,000 vehicles in December, following 14,092 vehicles produced in October and 5,526 vehicles in the first 11 days of November. Management attributed the production constraint to supply-chain ramp-up rather than manufacturing capacity.
Management said the gigafactory has achieved scheduled commercial operations date for 6 gigawatt-hours of cell capacity. It expects nickel manganese cobalt, or NMC, yields of 80% to 85% by the end of Q3 FY27 and around 90% in Q4 FY27. Management also expects lithium iron phosphate, or LFP, yield of around 70% by the end of Q4 FY27, when it plans to integrate its LFP cells into vehicles.
Conclusion
Ola's Q2 FY27 results combine a Rs 362 crore PAT loss, Rs 421 crore of revenue and a 29.93% reported gross margin. Revenue, gross margin in rupee terms and cash flow from operations declined or remained negative at the consolidated level, while operating expenses increased. Automotive supplied Rs 420 crore of revenue, whereas Cell added a Rs 38 crore adjusted operating EBITDA loss during its production ramp.
The next disclosed measures are management's target of about 25,000 vehicles of production in December, expected NMC yield progress by the end of Q3 FY27 and anticipated PLI receipts from the next quarter. Management's planned LFP cell integration by the end of Q4 FY27, alongside the dealer-channel transition, will provide subsequent evidence on revenue, costs and free cash flow.