










Page Industries Limited near 52-week low, below averages
Key highlights
- Page Industries Limited traded at ₹31,030 on the NSE on November 20, down 0.11% from the previous close.
- The stock's NSE day range was ₹30,650 to ₹31,280, and its 52-week range was ₹29,805 to ₹43,855.
- Page Industries was below its ₹35,506.80 50-day moving average and ₹36,417.90 200-day moving average.
- The supplied data showed a 13.1% one-month decline and a 20.08% one-year decline as of November 19.
powered by IRIS
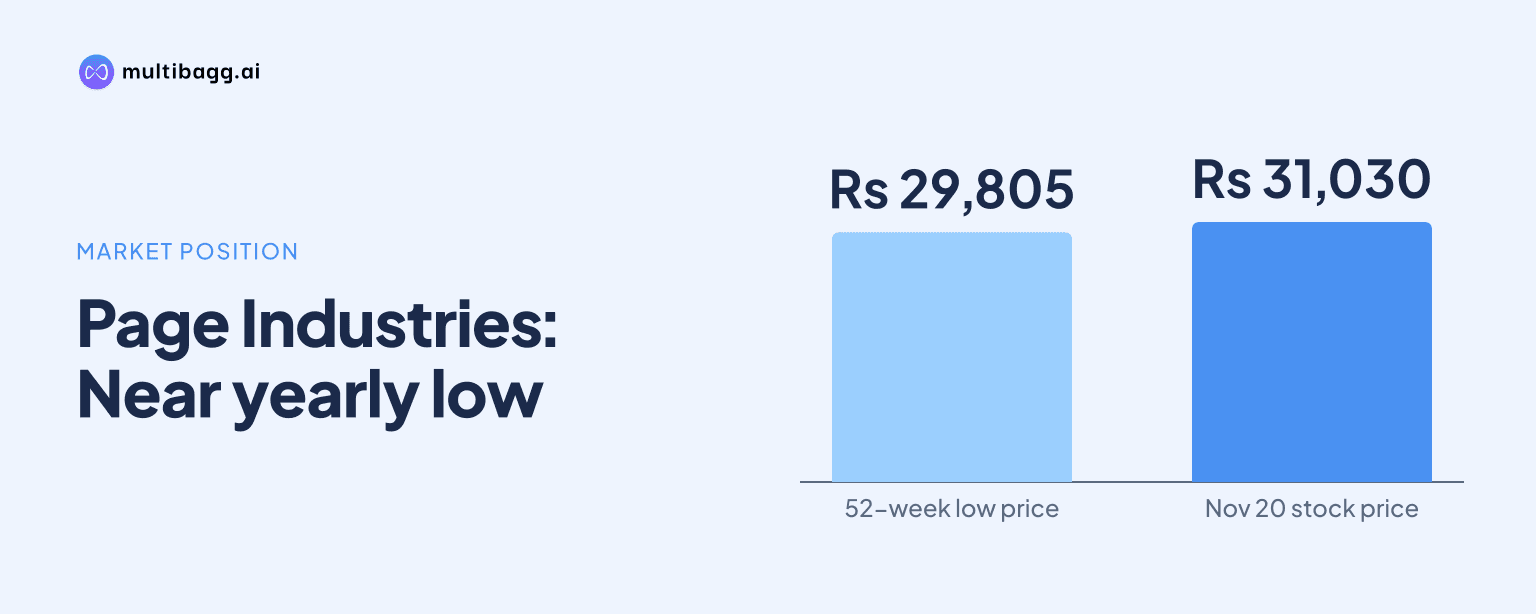
On November 20, 2026, Page Industries Limited traded at ₹31,030, about 4% above its 52-week low of ₹29,805. The NSE price was down ₹35, or 0.11%, from the prior close and remained below the stock's 50-day and 200-day moving averages, keeping the broader technical backdrop weak despite an intraday recovery from the day's low.
What happened to Page Industries shares on November 20?
Page Industries opened at ₹30,995, fell to ₹30,650 and rose as high as ₹31,280 on the NSE before the quoted ₹31,030 price at 1:22 PM IST. That placed the stock ₹380 above its intraday low, which is the immediate price action behind discussion of a reaction near a demand area.
The BSE quote showed a similar pattern. Page Industries was at ₹30,973.70 at 1:10 PM IST, down ₹52.30, or 0.17%, from its previous close of ₹31,026. Its BSE day range was ₹30,665.05 to ₹31,268.25, broadly matching the NSE movement.
The intraday bounce does not by itself establish a sustained reversal. The available data show that the stock remained lower on the day, while the price was still close to the bottom of its 52-week range.
How close is Page Industries to its 52-week low?
Page Industries was close to the lower end of its 52-week range, with the NSE quote of ₹31,030 only about 4% above the ₹29,805 low. The 52-week high was ₹43,855, leaving the observed price roughly 29% below that peak.
The distance from the high helps explain why traders are focused on lower price zones rather than a breakout. A move near a 52-week low can attract buying interest, but the supplied market data do not identify a confirmed reversal level or a defined proprietary demand zone.
What do Page Industries moving averages indicate?
Page Industries traded below both reported moving averages, signalling that its quoted price was weaker than recent average levels. The NSE 50-day moving average stood at ₹35,506.80 and the 200-day moving average at ₹36,417.90.
The BSE readings were similar, at ₹35,448.15 for the 50-day average and ₹36,401.82 for the 200-day average. The stock's price was therefore below both short-to-medium-term and longer-term reference averages on each exchange.
The context also labels the trend as bearish, even though one indicator summary showed four bullish indicators, two neutral indicators and two bearish indicators, for an overall slightly bullish reading. This mixed set of signals makes the price response around lower levels more relevant than any single indicator.
Got a follow-up? Ask IRIS
Which Page Industries price levels are being watched?
The reported support levels for Page Industries are ₹30,698.33, ₹30,291.67 and ₹29,728.33, while the reported resistance levels are ₹31,668.33, ₹32,231.67 and ₹32,638.33. The first support is close to the latest session low of ₹30,650, while the third support sits just below the 52-week low of ₹29,805.
On the upside, the ₹31,668.33 first resistance is above the latest NSE quote and above the day's high of ₹31,280. For the demand-zone discussion, the immediate question is whether the stock can continue to hold around the first support area rather than merely rebound within a volatile session.
The latest session's ₹630 NSE range, from ₹30,650 to ₹31,280, shows that price movement has been meaningful even within a single day. The provided data do not include a volume comparison for November 20, so there is no basis here to assess whether the intraday recovery had unusually strong trading participation.
How has Page Industries performed over recent periods?
Page Industries had declined 13.1% over one month, 12.36% over three months and 12.97% year to date, according to the supplied performance data as of November 19. The one-year return was negative 20.08%, while another cited data point put the one-year decline near 20%.
The six-month performance was also negative, with the context citing declines of 17.2%, 19.73% and 20.61% across different updates. Regardless of those differing snapshots, all of the supplied six-month and one-year readings point to a sustained period of share-price weakness before the latest demand-area discussion.
Conclusion
Page Industries Limited is trading near its 52-week low after recovering from an intraday low of ₹30,650, but it remains below its 50-day and 200-day moving averages. The reaction near lower levels is notable because the stock is close to reported support, yet the wider return data and moving-average position continue to indicate a weak broader trend.
Investors will watch whether Page Industries holds above the reported ₹30,698.33 first support area and whether it can move past the ₹31,668.33 first resistance. The unresolved issue is whether the intraday rebound develops into a sustained recovery while the share price remains below both key moving averages.