










Redington Q2 FY27 revenue rose 48% to Rs 43,002 crore
Key highlights
- Redington reported consolidated Q2FY27 revenue of Rs 43,002 crore, up 48% from Rs 29,118 crore in Q2FY26.
- Redington’s Q2FY27 PAT was Rs 581 crore, 50% above Rs 388 crore a year earlier.
- Redington’s Q2FY27 EBITDA was Rs 894 crore, compared with Rs 875 crore in Q1FY27.
- Redington reported 35 working-capital days in Q2FY27, versus 37 days in Q2FY26.
powered by IRIS
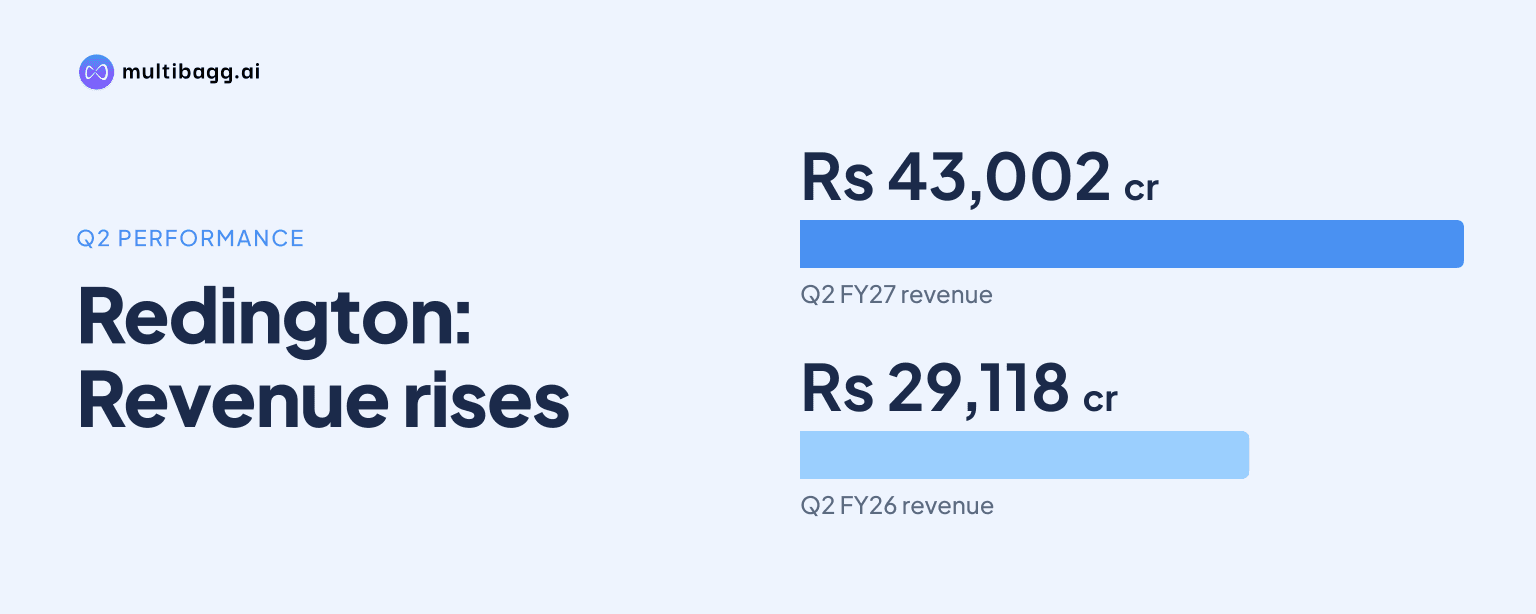
Redington Limited reported consolidated Q2FY27 revenue of Rs 43,002 crore, up 48% from Rs 29,118 crore in Q2FY26, while profit after tax reached Rs 581 crore, 50% above Rs 388 crore a year earlier. Earnings before interest, tax, depreciation and amortisation rose to Rs 894 crore from Rs 632 crore.
Know Redington inside out
Results, valuation, peers and who's buying, in one view.
How did Redington perform in Q2FY27?
Redington recorded Rs 43,002 crore of consolidated revenue in Q2FY27, an increase of Rs 13,884 crore from Rs 29,118 crore in Q2FY26 and Rs 6,056 crore from Rs 36,946 crore in Q1FY27. Gross margin, or GM, rose to Rs 1,910 crore from Rs 1,475 crore a year earlier and Rs 1,533 crore in the preceding quarter.
Earnings before interest, tax, depreciation and amortisation, or EBITDA, totalled Rs 894 crore in Q2FY27, compared with Rs 632 crore in Q2FY26 and Rs 875 crore in Q1FY27. Profit after tax, or PAT, was Rs 581 crore, exceeding the year-earlier quarter by Rs 193 crore and Q1FY27 by Rs 125 crore.
What changed from Q2FY26 to Q2FY27 at Redington?
Redington’s Q2FY27 revenue, GM, EBITDA and PAT each rose from Q2FY26 levels. Revenue increased by 48%, GM by 29%, EBITDA by 41% and PAT by 50%, based on the movement from Rs 29,118 crore, Rs 1,475 crore, Rs 632 crore and Rs 388 crore respectively.
The sequential movement differed between revenue and operating profit. Revenue increased by Rs 6,056 crore from Q1FY27 to Q2FY27 and GM increased by Rs 377 crore, but EBITDA rose by Rs 19 crore from Rs 875 crore to Rs 894 crore. The data book does not provide a bridge explaining the difference between GM and EBITDA movements.
Q2FY27 revenue also exceeded every quarterly revenue figure reported for FY26. The highest FY26 quarterly revenue was Rs 33,269 crore in Q4FY26, leaving Q2FY27 Rs 9,733 crore higher; Q2FY27 PAT of Rs 581 crore was Rs 145 crore above FY26’s quarterly high of Rs 436 crore in Q3FY26.
How did Redington’s working-capital metrics move?
Redington reported 35 working-capital days in Q2FY27, compared with 37 days in Q2FY26 and 32 days in Q1FY27. The two-day year-on-year reduction accompanied the increase in revenue to Rs 43,002 crore, while the measure rose by three days from the immediately preceding quarter.
Debtor days declined to 55 in Q2FY27 from 60 in Q2FY26 and 56 in Q1FY27. Inventory days were 33, compared with 32 in both comparison periods, while creditor days reached 55 versus 53 a year earlier and 52 in Q1FY27.
The source shows a five-day year-on-year reduction in debtor days, alongside one additional inventory day and two additional creditor days. It does not disclose the cash-conversion-cycle calculation or specific operating drivers behind the change in working-capital days from 37 to 35.
Got a follow-up? Ask IRIS
Which Redington businesses were largest before Q2FY27?
Redington’s disclosed consolidated vertical data for Q1FY27 show Mobility Solutions Group, or MSG, at Rs 10,500 crore, Technology Solutions Group, or TSG, at Rs 8,905 crore, and Enterprise Solutions Group, or ESG, at Rs 8,225 crore. The three figures total Rs 27,630 crore, compared with consolidated Q1FY27 revenue of Rs 36,946 crore.
Against Q1FY26, TSG increased from Rs 6,754 crore to Rs 8,905 crore, MSG rose from Rs 9,120 crore to Rs 10,500 crore, and ESG increased from Rs 7,544 crore to Rs 8,225 crore. The data book does not disclose consolidated Q2FY27 vertical figures, so it does not identify business-level contributors to the Rs 43,002 crore result.
For FY26, MSG was the largest disclosed consolidated vertical at Rs 39,681 crore, followed by ESG at Rs 34,982 crore and TSG at Rs 32,349 crore. In FY25, MSG was Rs 35,987 crore, ESG was Rs 31,419 crore and TSG was Rs 26,915 crore, showing increases for all three disclosed verticals in FY26.
What do Redington’s return and cash-flow figures show?
Redington reported net return on invested capital, or ROIC, of 24.6% in Q2FY27, compared with 14.5% in Q2FY26 and 22.2% in Q1FY27. Return on capital employed, or ROCE, was 22.7%, versus 15.9% a year earlier and 21.2% in the preceding quarter.
Free cash flow, or FCF, was negative Rs 1,871 crore in Q2FY27, compared with positive Rs 1,523 crore in Q2FY26 and negative Rs 995 crore in Q1FY27. Inventory provisions were 0.1%, down from 0.8% in Q1FY27, while accounts-receivable provisions were 0.2%, compared with 0.0% in the preceding quarter.
Conclusion
Redington’s Q2FY27 data show a material year-on-year increase in consolidated revenue and PAT, with revenue reaching Rs 43,002 crore and PAT reaching Rs 581 crore. GM rose by Rs 435 crore and EBITDA by Rs 262 crore from Q2FY26, while working-capital days reduced to 35 from 37 despite the higher revenue base.
What to watch next is whether later quarterly disclosures clarify the drivers of negative FCF of Rs 1,871 crore alongside PAT of Rs 581 crore and identify the business mix behind Q2FY27 growth. The data book leaves Q2FY27 consolidated vertical data undisclosed and shows blank consolidated fields for Q3FY27, Q4FY27 and FY27.