










Remsons H1FY27 standalone profit rose 61%, consolidated flat
Key highlights
- Remsons' standalone H1FY27 PAT rose 61% to Rs 7.7 crore.
- Remsons' consolidated H1FY27 revenue rose 19% to Rs 255.2 crore.
- Remsons' consolidated EBITDA margin fell to 9% in H1FY27 from 11% a year earlier.
- Remsons' consolidated net PAT was Rs 7.6 crore in H1FY27 versus Rs 7.7 crore in H1FY26.
powered by IRIS
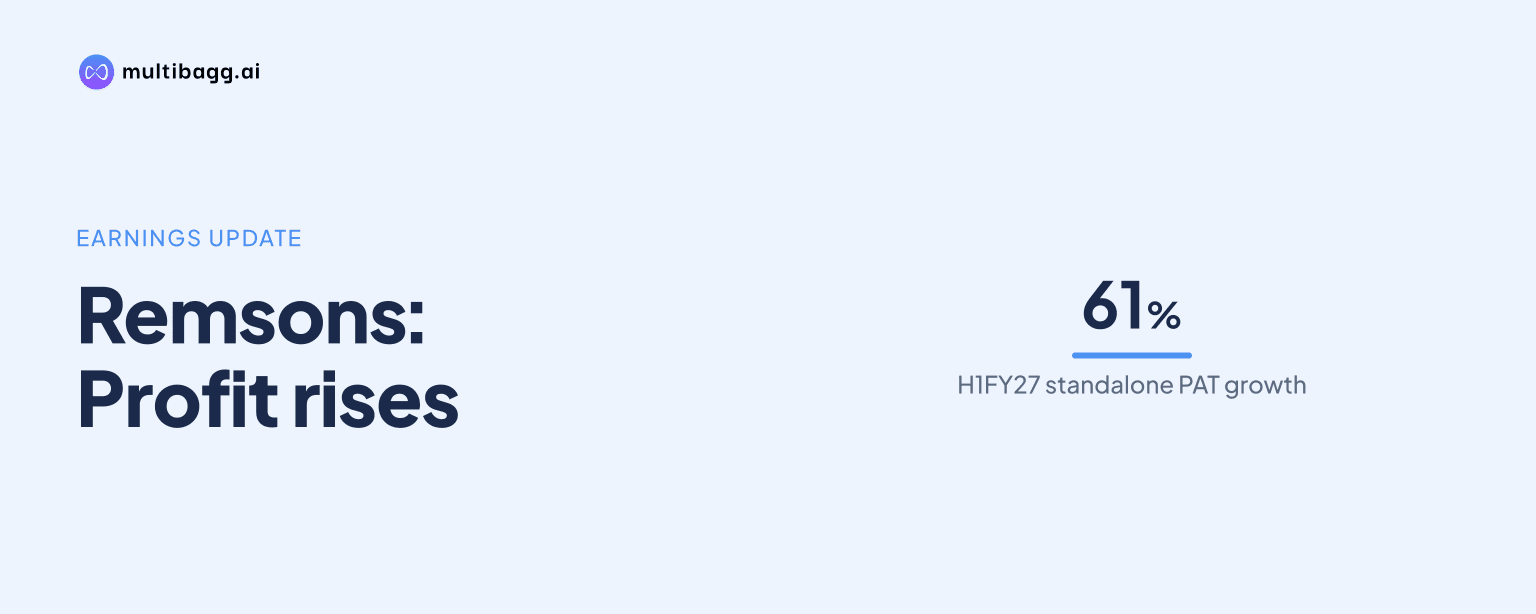
Remsons Industries Limited reported standalone profit after tax of Rs 7.7 crore in H1FY27, up 61% year on year, while consolidated net profit was Rs 7.6 crore, down 1% from Rs 7.7 crore. The difference arose as consolidated revenue grew 19% to Rs 255.2 crore but consolidated EBITDA margin fell to 9% from 11%.
Know Remsons Industries inside out
Results, valuation, peers and who's buying, in one view.
Why did Remsons' standalone and consolidated H1FY27 profits differ?
Remsons' standalone profit rose because revenue and operating earnings increased materially in the standalone accounts. Standalone revenue from operations rose 30% to Rs 193.1 crore in H1FY27 from Rs 148.1 crore in H1FY26, while EBITDA, or earnings before interest, tax, depreciation and amortisation, rose 44% to Rs 17.6 crore. Standalone PAT, or profit after tax, rose to Rs 7.7 crore from Rs 4.8 crore.
The consolidated figures followed a different path. Consolidated revenue increased 19% to Rs 255.2 crore, but EBITDA declined 5% to Rs 22.7 crore from Rs 23.9 crore. Consolidated PAT, before the share of minority interest, fell 30% to Rs 7.9 crore from Rs 11.2 crore, while net PAT was Rs 7.6 crore against Rs 7.7 crore in H1FY26. The presentation reports these results but does not give a specific operational explanation for the divergence.
How did Remsons' H1FY27 margins change?
Remsons' consolidated EBITDA margin fell by 222 basis points to 9% in H1FY27 from 11% in H1FY26. Consolidated PAT margin declined by 212 basis points to 3% from 5%, while net PAT margin declined by 59 basis points to 3% from 4%. A basis point is one-hundredth of a percentage point.
Standalone margins increased over the same period. Standalone EBITDA margin rose by 89 basis points to 9% from 8%, and standalone PAT margin increased by 76 basis points to 4% from 3%. Depreciation on the consolidated accounts rose 16% to Rs 8.8 crore, interest rose 15% to Rs 4.8 crore, and other income declined 22% to Rs 1.6 crore, contributing to a 25% decline in consolidated profit before tax to Rs 10.6 crore.
What did Remsons report for 2QFY27?
Remsons reported consolidated net PAT of Rs 4.7 crore in 2QFY27, up 17% from Rs 4.1 crore in 2QFY26 and 65% from Rs 2.9 crore in 1QFY27. Consolidated revenue was Rs 135.5 crore, up 17% year on year and 13% sequentially from Rs 119.7 crore in 1QFY27.
The quarterly revenue increase did not reverse the year-on-year margin comparison. Consolidated EBITDA was Rs 12.2 crore in 2QFY27, down 8% from Rs 13.3 crore a year earlier, and EBITDA margin was 9% against 12%. Standalone revenue rose 29% to Rs 105.6 crore, EBITDA rose 43% to Rs 10.1 crore and PAT rose 76% to Rs 4.9 crore, with standalone PAT margin increasing to 5% from 3%.
Got a follow-up? Ask IRIS
How does H1FY27 compare with Remsons' longer-term financial trend?
Remsons' consolidated revenue increased from Rs 286.5 crore in FY22 to Rs 468.7 crore in FY26, while EBITDA increased from Rs 20.2 crore to Rs 49.5 crore. EBITDA margin rose from 7% in FY22 to 11% in FY26 before declining to 9% in H1FY27. Consolidated net PAT increased from Rs 5.4 crore in FY22 to Rs 18.1 crore in FY26.
Remsons reported basic earnings per share of Rs 2.18 in H1FY27, marginally below Rs 2.21 in H1FY26, compared with Rs 5.18 for the full FY26. Net worth increased to Rs 164.6 crore at H1FY27 from Rs 156.9 crore at FY26, while total assets rose to Rs 379.6 crore from Rs 360.7 crore. Inventory rose to Rs 82.8 crore and trade receivables to Rs 76.4 crore, from Rs 78.9 crore and Rs 75.6 crore respectively at FY26.
What is Remsons' stated response to industry conditions?
Remsons says its response includes expansion into new-technology products, coverage across automotive sectors, an expanded heavy commercial vehicle product range, and organic and inorganic expansion. The presentation identifies geopolitical issues, high inflation, electric-vehicle transition, labour costs, trade disruption, and crude, steel and copper price volatility as industry challenges.
Remsons reported domestic sales of Rs 167.5 crore and exports of Rs 87.6 crore in H1FY27, compared with FY26 domestic sales of Rs 289.2 crore and exports of Rs 179.5 crore. The presentation also cites the 2020 acquisition of Magal Cables Ltd, renamed Remsons Automotive UK Ltd, as a route to extend the client base and access European global clients. Its stated manufacturing locations include Gurugram, Chakan, Shirwal, Pardi, Stourport and Redditch.
Conclusion
Remsons' H1FY27 results show a clear difference between the standalone business and the consolidated group. Standalone revenue growth of 30%, margin expansion and PAT growth of 61% contrasted with consolidated revenue growth of 19%, a 5% EBITDA decline, lower margins and net PAT that was broadly unchanged at Rs 7.6 crore.
The next disclosed indicators to watch are whether Remsons' focus on new-technology products, heavy commercial vehicles, exports, acquisitions and product-mix change supports consolidated profitability in the remaining half of FY27. Consolidated EBITDA margin, at 9% in H1FY27 against 11% in H1FY26 and FY26, is the central operating comparison in that assessment.