










Star Imaging H1 FY27 profit falls 22% as costs rise faster
Key highlights
- Star Imaging reported H1 FY27 revenue of Rs 48.9 crore, up 8% year on year.
- H1 FY27 profit after tax was Rs 7.8 crore, down 22% from Rs 10.0 crore.
- EBIDTA margin declined 936 basis points to 28.9% in H1 FY27.
- Working-capital changes used Rs 17.5 crore in H1 FY27, contributing to Rs 6.2 crore of negative operating cash flow.
powered by IRIS
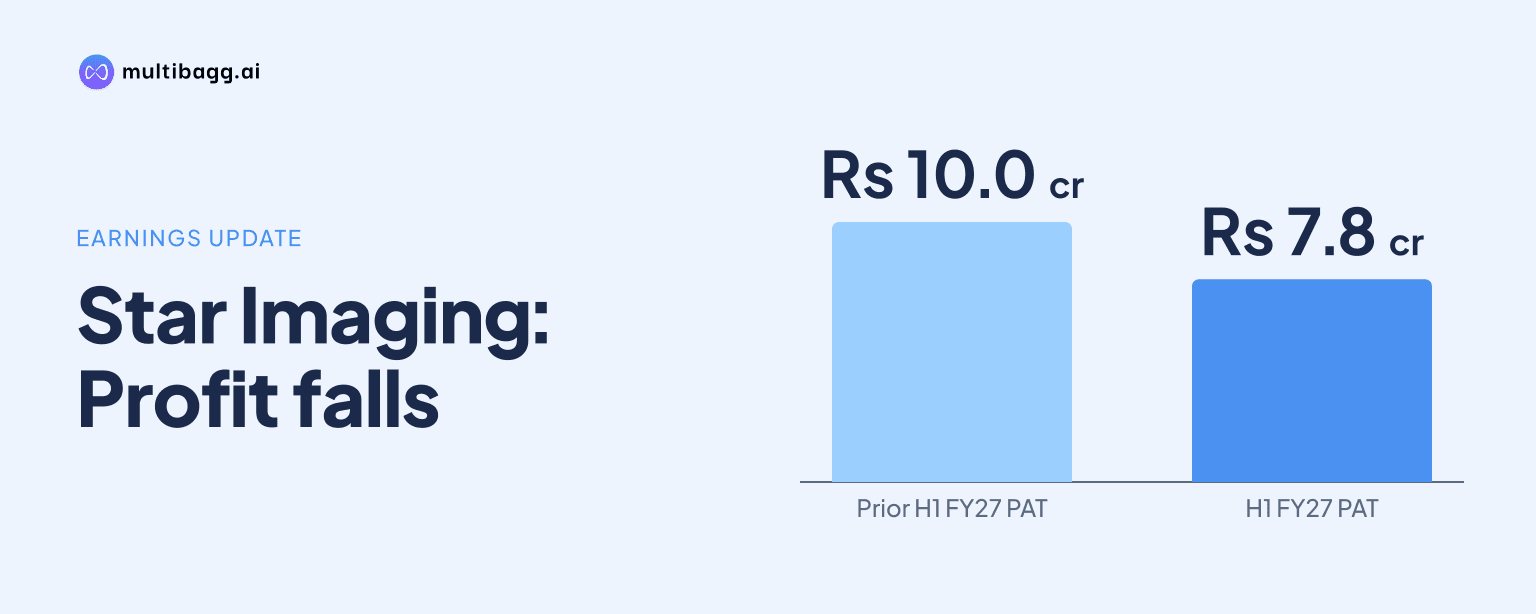
Star Imaging and Path Lab Limited reported profit after tax of Rs 7.8 crore in H1 FY27, down 22% year on year, despite revenue from operations rising 8% to Rs 48.9 crore. Operating expenses, employee costs and other expenses increased faster than revenue, while working-capital changes contributed to negative operating cash flow of Rs 6.2 crore.
Know Star Imaging and Path Lab inside out
Results, valuation, peers and who's buying, in one view.
Why did Star Imaging's H1 FY27 profit fall despite revenue growth?
Star Imaging's H1 FY27 profit fell because expense growth exceeded the increase in revenue. Revenue from operations increased by Rs 3.7 crore to Rs 48.9 crore from Rs 45.2 crore in H1 FY26, but operating expense and cost of material consumed rose by Rs 3.8 crore to Rs 20.5 crore, a 23% increase.
Employee benefits expense rose 23% to Rs 5.1 crore from Rs 4.1 crore, while other expenses increased 30% to Rs 9.3 crore from Rs 7.1 crore. These three cost lines collectively increased by Rs 6.5 crore, compared with the Rs 3.7 crore rise in revenue, reducing earnings before interest, depreciation, tax and amortisation, labelled EBIDTA in the presentation, by Rs 3.2 crore.
Profit before tax declined 21% to Rs 10.7 crore from Rs 13.5 crore. A 74% reduction in finance costs, to Rs 0.3 crore from Rs 1.3 crore, partly offset the operating decline, but depreciation and amortisation rose 19% to Rs 3.4 crore and other income fell 24% to Rs 0.3 crore.
How much did Star Imaging's margins contract in H1 FY27?
Star Imaging's EBIDTA margin contracted by 936 basis points to 28.9% in H1 FY27 from 38.2% in H1 FY26. The decline means costs absorbed a larger share of the Rs 48.9 crore of revenue, even though the business recorded top-line growth during the half year.
The profit-after-tax margin fell 623 basis points to 16.0% from 22.2%. Tax expense declined 20% to Rs 2.9 crore from Rs 3.6 crore, broadly in line with the reduction in profit before tax, but this was not sufficient to prevent a Rs 2.2 crore reduction in profit after tax.
The H1 FY27 margin movement contrasts with the full-year trend through FY26. EBIDTA margin increased from 28.5% in FY24 to 34.3% in FY25 and then 37.2% in FY26, while profit-after-tax margin increased from 15.8% to 19.1% and 21.8%, respectively. Full-year FY26 revenue was Rs 88.5 crore, 6% above Rs 83.5 crore in FY25, and EBIDTA was Rs 33.0 crore, 15% higher than Rs 28.6 crore.
The presentation does not allocate the H1 FY27 expense increases between radiology, medical, genetic or molecular diagnostic services. It therefore shows the aggregate cost and margin outcome, rather than identifying a service-line source for the 936-basis-point EBIDTA margin change.
Got a follow-up? Ask IRIS
What caused Star Imaging's negative operating cash flow?
Star Imaging generated negative net cash from operating activities of Rs 6.2 crore in H1 FY27 because a Rs 17.5 crore working-capital outflow exceeded profit before tax and non-cash adjustments. Profit before tax was Rs 10.7 crore and non-cash and non-operating adjustments added Rs 3.5 crore, while direct taxes paid were Rs 2.9 crore.
The H1 FY27 operating-cash outcome differs from FY26, when Star Imaging reported operating cash inflow of Rs 23.3 crore despite a Rs 3.2 crore working-capital outflow. It also follows negative operating cash flow of Rs 2.6 crore in FY25, when working-capital changes consumed Rs 25.9 crore, compared with a Rs 18.3 crore operating cash inflow in FY24.
Trade receivables increased to Rs 64.0 crore at H1 FY27 from Rs 49.9 crore at FY26, a Rs 14.1 crore increase. Long-term loans and advances rose by Rs 6.3 crore to Rs 14.8 crore over the same period, while other current assets declined to Rs 5.3 crore from Rs 7.4 crore; the presentation does not provide a line-by-line reconciliation of these balance-sheet movements to the Rs 17.5 crore working-capital change.
How did investing, financing and liquidity change in H1 FY27?
Star Imaging's cash and cash equivalents decreased by Rs 25.6 crore during H1 FY27 to Rs 26.0 crore from an opening Rs 51.6 crore. Net investing cash outflow was Rs 12.8 crore, comprising Rs 6.8 crore of net fixed-asset purchases and Rs 6.3 crore of long-term loans and advances, partly offset by Rs 0.3 crore of interest and dividend received.
Financing activities used Rs 6.6 crore in H1 FY27, led by Rs 6.2 crore of borrowing repayment and Rs 0.3 crore of finance costs paid. This compares with Rs 35.7 crore of financing inflow in FY26, when the company recorded Rs 49.7 crore from the issue of shares including premium net of initial public offering-related expense, alongside Rs 12.1 crore of borrowing repayment.
The balance sheet shows total borrowings of Rs 14.4 crore at H1 FY27, comprising Rs 2.5 crore of long-term borrowings and Rs 11.9 crore of short-term borrowings. That was lower than Rs 20.7 crore at FY26, when long-term and short-term borrowings were Rs 6.6 crore and Rs 14.1 crore, respectively; finance costs in the profit statement correspondingly fell to Rs 0.3 crore in H1 FY27.
Property, plant and equipment increased to Rs 28.6 crore at H1 FY27 from Rs 25.2 crore at FY26. Total assets were Rs 150.9 crore versus Rs 153.6 crore at FY26, as total current assets declined by Rs 12.9 crore to Rs 101.9 crore, chiefly reflecting the Rs 25.6 crore reduction in cash despite higher receivables.
Conclusion
Star Imaging's H1 FY27 results show that 8% revenue growth did not translate into higher earnings or operating cash generation. The 23% increase in operating expense and material consumed, 23% increase in employee benefits and 30% increase in other expenses reduced EBIDTA by 18%, while a Rs 17.5 crore working-capital outflow turned operating cash flow negative.
The next disclosed financial points to watch are whether trade receivables, which reached Rs 64.0 crore at H1 FY27, and long-term loans and advances, which reached Rs 14.8 crore, reverse or continue to absorb cash. The presentation also shows Rs 6.8 crore of H1 FY27 fixed-asset purchases and property, plant and equipment of Rs 28.6 crore, but does not disclose a capital-expenditure target or a working-capital reduction plan.