










Star Imaging shifts revenue mix as B2C and B2B outpace B2G revenue
Key highlights
- B2C revenue rose 21% year on year to Rs 18.2 crore in H1 FY27.
- B2B revenue increased 20% to Rs 5.2 crore as the tie-up network exceeded 150 hospitals.
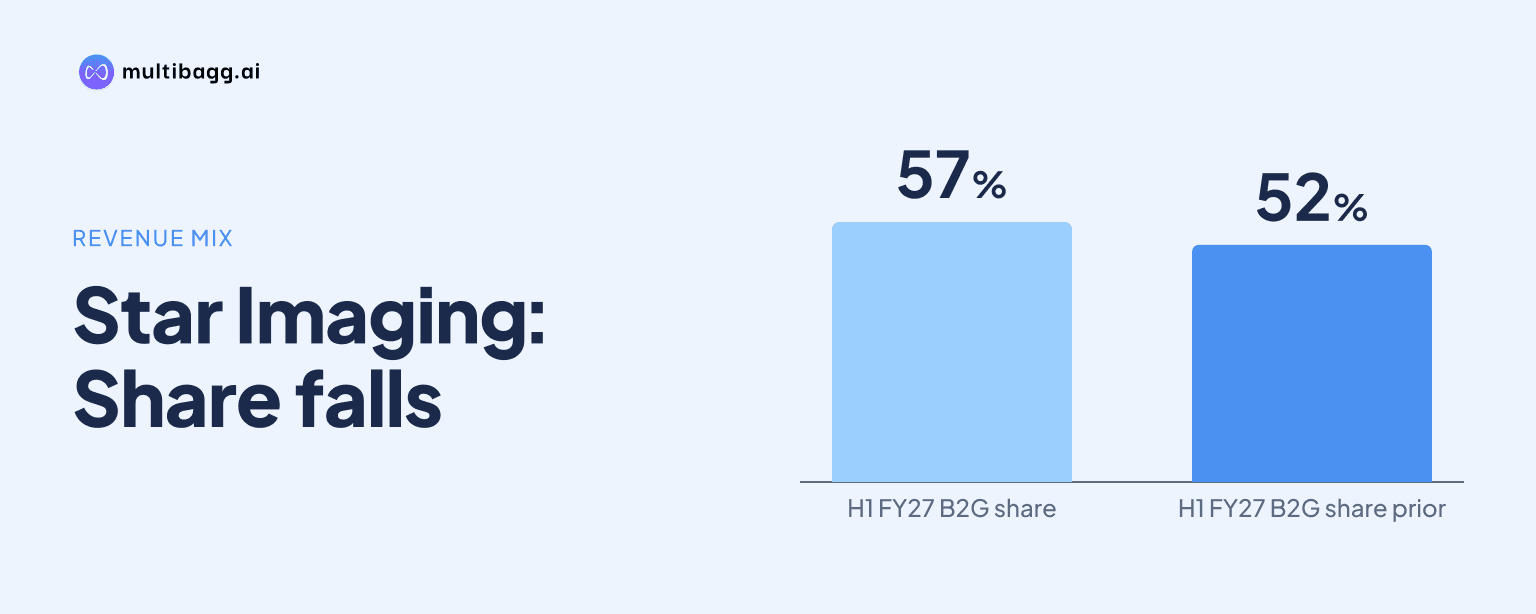
- B2G revenue declined 1% to Rs 25.6 crore and its contribution fell to 52% from 57%.
- Total H1 FY27 revenue was Rs 48.9 crore, up 8%, while EBITDA declined to Rs 14.1 crore.
powered by IRIS
Star Imaging and Path Lab Limited shifted its H1 FY27 revenue mix toward direct patients and hospital partners as B2C revenue rose 21% to Rs 18.2 crore, B2B grew 20% to Rs 5.2 crore and B2G declined 1% to Rs 25.6 crore. Total revenue from operations increased 8% to Rs 48.9 crore.
Know Star Imaging and Path Lab inside out
Results, valuation, peers and who's buying, in one view.
How did Star Imaging's revenue mix change in H1 FY27?
Star Imaging reduced B2G's reported revenue contribution to 52% in H1 FY27 from 57% in H1 FY26, while B2C increased to 37% from 33% and B2B rose to 11% from 10%. B2G represents government and public-private partnership, or PPP, diagnostic services; B2C comprises direct-to-patient diagnostics; and B2B covers services delivered through hospital and healthcare-provider tie-ups.
B2C and B2B together accounted for 48% of H1 FY27 revenue, compared with 43% in H1 FY26. B2G remained the largest individual channel at Rs 25.6 crore, against Rs 5.2 crore from B2B, meaning the reported movement reduced but did not remove the business's dependence on government and PPP activity.
The presentation qualifies the channel comparison because one business previously classified under B2C was reclassified as B2B in the current presentation. Star Imaging did not disclose the revenue value affected by that reclassification, so the change in channel shares should not be read entirely as underlying customer-channel growth.
Which channels drove Star Imaging's H1 FY27 growth?
B2C was the largest contributor to revenue growth in absolute terms, adding Rs 3.2 crore from Rs 15.0 crore in H1 FY26 to Rs 18.2 crore in H1 FY27. B2B added Rs 0.9 crore, rising from Rs 4.3 crore to Rs 5.2 crore, while B2G declined by Rs 0.2 crore from Rs 25.8 crore to Rs 25.6 crore.
Management attributed growth to stronger B2B partnerships, rising B2C activity and improved operational efficiencies across existing centres. The B2B hospital tie-up network added 40 to 45 hospitals in H1 FY27, taking the total to more than 150 tie-ups, and Star Imaging installed a high-end 640-slice computed tomography, or CT, scanner.
Star Imaging's diagnostic-centre network expanded to 26 in H1 FY27 from 24 in FY26, while team size increased to 266 from 236. Management said better operational efficiency and capacity utilisation at existing centres supported organic growth, but the presentation does not allocate the additional two centres or 30 employees among B2C, B2B and B2G.
Got a follow-up? Ask IRIS
What does the channel shift mean for Star Imaging's government exposure?
The shift means Star Imaging generated a larger reported share of H1 FY27 revenue from direct patients and hospital partners, although B2G still supplied 52% of total revenue. Revenue from government and PPP diagnostic services was Rs 25.6 crore in H1 FY27, down from Rs 25.8 crore a year earlier, while total revenue increased from Rs 45.2 crore to Rs 48.9 crore.
Management said it is strengthening B2C contribution to reduce dependence on government receivables and support positive operating cash flows. That stated objective follows cash flow from operations of negative Rs 6.2 crore in H1 FY27, compared with Rs 23.3 crore in FY26; the presentation provides a full-year FY26 comparator rather than an H1 FY26 figure.
Geographic results also showed different trends within the 26-centre network. Delhi revenue rose to Rs 24.9 crore in H1 FY27 from Rs 19.9 crore in H1 FY26 across seven centres, while Uttar Pradesh revenue declined to Rs 22.4 crore from Rs 23.7 crore across 18 centres. Nashik, which uses a royalty-based B2G model, reported Rs 1.7 crore from one centre, up from Rs 1.6 crore.
Did Star Imaging's revenue growth translate into higher H1 FY27 profit?
No, Star Imaging's 8% revenue growth in H1 FY27 coincided with lower reported earnings, with earnings before interest, tax, depreciation and amortisation, or EBITDA, falling to Rs 14.1 crore from Rs 17.3 crore in H1 FY26. Profit after tax, or PAT, declined to Rs 7.8 crore from Rs 10.0 crore, while EBITDA margin fell to 29% from 38% and PAT margin to 16.0% from 22.2%.
Finance costs declined 74% year on year to Rs 33 lakh in H1 FY27, and management said two loans were fully repaid as Star Imaging progresses towards a debt-free position. Net debt to equity was negative 0.1 times in H1 FY27, compared with negative 0.3 times in FY26, but the supplied presentation does not explain the lower profit margins.
Service revenue remained led by radiology at Rs 39.7 crore in H1 FY27, up 6% from Rs 37.4 crore in H1 FY26, although its share fell to 81% from 83%. Pathology grew 17% to Rs 7.6 crore and represented 16% of revenue, up from 14%, while cardiology grew 22% to Rs 1.3 crore and accounted for 3%.
Conclusion
Taken together, the H1 FY27 results show a broader reported channel base, with direct-patient and hospital-partner services contributing 48% of revenue while B2G remained the largest source at 52%. This mix movement accompanied an 8% increase in revenue, but lower EBITDA, PAT and operating cash flow show that the revenue change did not coincide with higher reported earnings for the period.
The next results should show whether management's plan to strengthen B2C and expand B2B partnerships changes the level of B2G revenue and government receivables exposure. Investors can also monitor operating cash flow after the negative Rs 6.2 crore reported in H1 FY27, progress toward the debt-free position after two loan repayments, and utilisation across 26 centres and the 640-slice CT scanner.