










Sunlite Recycling Industries Limited PAT rises 131.5%
Key highlights
- Sunlite’s standalone H1FY27 PAT rose 131.5% year on year to Rs 33.21 crore.
- Sunlite’s standalone H1FY27 total income increased 74.8% to Rs 1,962.31 crore.
- Sunlite’s standalone EBITDA margin increased 43 basis points year on year to 2.38%.
- Sunlite’s H1FY27 sales volume increased 10.6% to 13,831 metric tonnes.
powered by IRIS
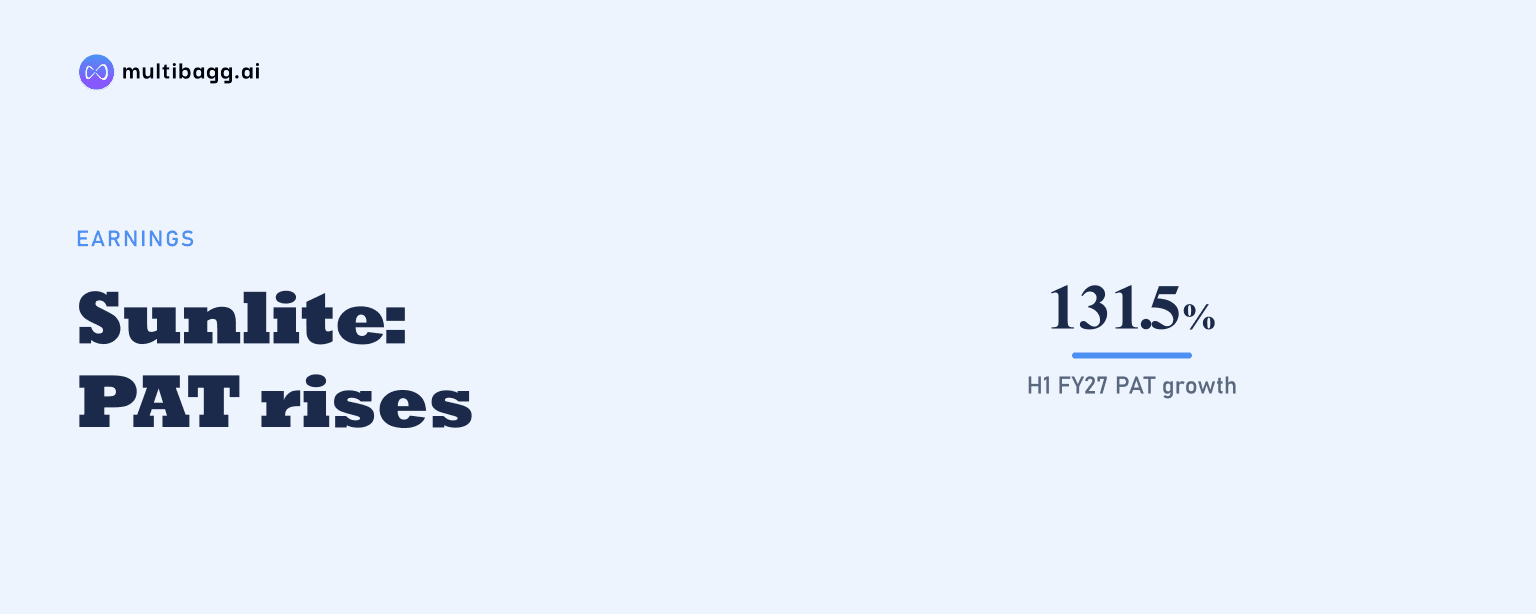
In H1FY27, Sunlite Recycling Industries Limited reported standalone profit after tax of Rs 33.21 crore, up 131.5% year on year, while total income increased 74.8% to Rs 1,962.31 crore and EBITDA margin reached 2.38%. Sales volume rose 10.6% to 13,831 metric tonnes over the same period.
Know Sunlite Recycling Industries inside out
Results, valuation, peers and who's buying, in one view.
How much did Sunlite’s H1FY27 profit grow?
Sunlite’s standalone profit after tax (PAT) rose to Rs 33.21 crore in H1FY27 from Rs 14.34 crore in H1FY26, an increase of 131.5%. Profit before tax (PBT) increased 131.1% to Rs 44.36 crore from Rs 19.20 crore, while tax expense rose to Rs 11.15 crore from Rs 4.85 crore. PAT margin increased to 1.69% from 1.28%.
Total income rose 74.8% to Rs 1,962.31 crore from Rs 1,122.31 crore, while earnings before interest, tax, depreciation and amortisation (EBITDA) increased 113.7% to Rs 46.79 crore from Rs 21.90 crore. Earnings per share (EPS) rose 82.5% to Rs 24.06 from Rs 13.18, below the reported PAT growth rate.
Did Sunlite’s margins improve in H1FY27?
Sunlite’s standalone EBITDA margin improved to 2.38% in H1FY27 from 1.95% in H1FY26, an expansion of 43 basis points. PBT margin rose by 55 basis points to 2.26%, and PAT margin increased by 41 basis points to 1.69%. Each of the three reported standalone margin measures was higher than a year earlier.
Total expenditure increased 74.1% to Rs 1,915.52 crore in H1FY27 from Rs 1,100.41 crore, slightly below the 74.8% growth in total income. This accompanied a Rs 24.89 crore increase in EBITDA. The presentation does not separately quantify the contribution from product mix, selling prices, input costs or operating efficiencies.
How did Sunlite perform versus H2FY26?
Sunlite’s standalone PAT increased 28.7% sequentially to Rs 33.21 crore in H1FY27 from Rs 25.80 crore in H2FY26. PBT rose 28.2% to Rs 44.36 crore from Rs 34.61 crore, EBITDA increased 23.8% to Rs 46.79 crore from Rs 37.79 crore, and total income grew 19.5% from Rs 1,642.41 crore.
Sequential margins also moved higher in H1FY27. EBITDA margin rose by 8 basis points from 2.30% in H2FY26, PBT margin increased by 15 basis points from 2.11%, and PAT margin rose by 12 basis points from 1.57%. Total expenditure increased 19.4% to Rs 1,915.52 crore from Rs 1,604.62 crore.
Got a follow-up? Ask IRIS
Was revenue growth matched by higher sales volume?
Sunlite’s sales volume increased 10.6% to 13,831 metric tonnes in H1FY27 from 12,502 metric tonnes in H1FY26, while standalone total income rose 74.8%. The difference between the two reported growth rates means the income increase was not explained by the disclosed volume growth alone. Sunlite does not provide a revenue-per-tonne figure or a product-level price and mix bridge in these pages.
Copper rods operated at 100.90% annualised utilisation in H1FY27 against capacity of 25,000 metric tonnes per annum, compared with 95.02% in H2FY26 and 92.20% in H1FY26. Total copper capacity utilisation rose to 91.41% from 87.19% in H2FY26, while copper-wire utilisation was 44.53%, below the 47.92% reported in H1FY26.
What operating figures should be tracked after H1FY27?
Sunlite reported consolidated H1FY27 total income of Rs 2,075.51 crore and PAT of Rs 34.27 crore, compared with standalone income of Rs 1,962.31 crore and PAT of Rs 33.21 crore. Consolidated EBITDA margin was 2.37%, close to the standalone 2.38%. The presentation’s year-on-year comparisons are shown on a standalone basis.
Capacity utilisation differs materially across the disclosed products. Aluminium rods operated at 51.10% against capacity of 12,000 metric tonnes per annum, copper busbars at 36.26% against 720 metric tonnes per annum, and value-added copper wires at 64.60% against 1,920 metric tonnes per annum. The presentation provides no future revenue, margin, volume or capacity-expansion target.
Conclusion
Sunlite’s H1FY27 figures show PAT growing faster than total income and sales volume, alongside year-on-year and sequential gains in EBITDA, PBT and PAT margins. Standalone total income increased by Rs 840 crore year on year, while PAT increased by Rs 18.87 crore and EBITDA margin rose from 1.95% to 2.38%.
The next disclosed results will show whether Sunlite maintains margins above the H1FY27 levels as expenditure and income change. Capacity utilisation is also an unresolved operating measure to watch, with copper rods at 100.90% annualised utilisation while copper strips were at 12.49% against capacity of 720 metric tonnes per annum.