










Suyog Q2 profit fell 7.7% as depreciation and interest rose
Key highlights
- Suyog’s Q2’FY27 revenue rose 2.8% year on year to Rs 71.7 crore.
- Suyog’s Q2’FY27 EBITDA rose 3.3% to Rs 43.08 crore and margin reached 60.1%.
- Suyog’s Q2’FY27 net profit fell 7.7% year on year to Rs 15.34 crore as interest expense rose 37.5%.
- Suyog’s non-current financial liabilities were Rs 312.95 crore at H1’FY27, versus Rs 130.95 crore at FY25.
powered by IRIS
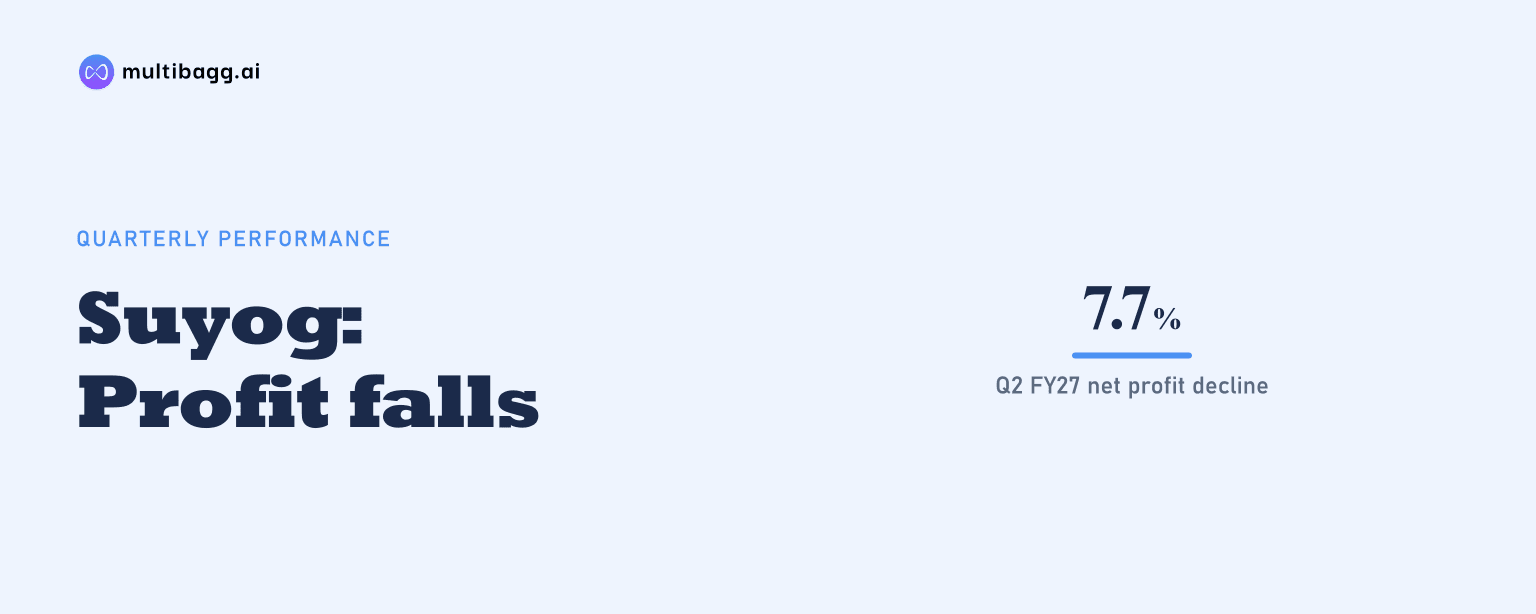
Suyog Telematics Limited reported consolidated Q2’FY27 revenue of Rs 71.7 crore, up 2.8% year on year, while net profit fell 7.7% to Rs 15.34 crore as depreciation rose 12.8% and interest expense increased 37.5%. EBITDA rose 3.3% to Rs 43.08 crore and the EBITDA margin improved to 60.1%.
Know Suyog Telematics inside out
Results, valuation, peers and who's buying, in one view.
What were Suyog’s Q2’FY27 revenue and operating results?
Suyog’s revenue from operations was Rs 71.7 crore in Q2’FY27, compared with Rs 69.73 crore in Q2’FY26 and Rs 70.95 crore in Q1’FY27. The company reported 2.8% year-on-year growth and 1.1% quarter-on-quarter growth. Consolidated revenue per tower per month, excluding reimbursement of electricity charges, was Rs 30,710 in Q2’FY27.
Suyog’s EBITDA, or earnings before interest, tax, depreciation and amortisation, increased to Rs 43.08 crore from Rs 41.69 crore in Q2’FY26 and Rs 42.09 crore in Q1’FY27. EBITDA margin was 60.1%, up 29 basis points from 59.8% a year earlier and 76 basis points from 59.3% in the preceding quarter. One basis point equals one-hundredth of a percentage point.
Revenue per tower per month declined from Rs 31,511 in Q2’FY26 and Rs 31,105 in Q1’FY27 to Rs 30,710 in Q2’FY27. This measure excludes electricity-charge reimbursement even though those reimbursements form part of revenue from operations, according to the presentation.
Why did Suyog’s Q2’FY27 net profit decline?
Suyog’s Q2’FY27 net profit declined because increases in depreciation and interest exceeded the growth in EBITDA. Depreciation rose to Rs 17.68 crore from Rs 15.67 crore in Q2’FY26, while interest expense increased to Rs 7.65 crore from Rs 5.57 crore. Profit before tax consequently fell 6.3% to Rs 20.56 crore despite other income rising to Rs 2.81 crore from Rs 1.48 crore.
Net profit margin was 21.4% in Q2’FY27, compared with 23.8% in Q2’FY26, a decline of 245 basis points. Net profit was nevertheless 5.8% above Q1’FY27’s Rs 14.5 crore, and the margin improved 96 basis points from 20.4%. The presentation reported quarterly earnings per share of Rs 13.09.
Cost of materials consumed fell 5.8% year on year to Rs 17.04 crore in Q2’FY27 from Rs 18.09 crore. However, employee benefit expenses increased 14.8% to Rs 6.42 crore and other expenses rose 18.4% to Rs 5.16 crore. Total expenditure rose 2.1% to Rs 28.62 crore, below the 2.8% revenue increase, supporting the higher EBITDA margin.
How did Suyog perform in H1’FY27?
Suyog’s H1’FY27 revenue from operations increased 4.5% to Rs 142.65 crore from Rs 136.57 crore in H1’FY26, while EBITDA rose 2.8% to Rs 85.17 crore from Rs 82.82 crore. EBITDA margin declined by 94 basis points to 59.7% from 60.6%, as total expenditure increased 6.9% to Rs 57.48 crore.
Net profit for H1’FY27 fell 12.1% to Rs 29.84 crore from Rs 33.94 crore in H1’FY26. Profit before tax decreased 8.3% to Rs 40.07 crore, while net profit margin declined by 394 basis points to 20.9%. Depreciation was Rs 34.98 crore, up 13.6%, and interest was Rs 15.14 crore, up 29.9%.
The quarterly and half-year margin trends differed because Q2’FY27 improved from Q1’FY27. The Q2’FY27 EBITDA margin of 60.1% exceeded both Q1’FY27’s 59.3% and Q2’FY26’s 59.8%, but the H1’FY27 margin remained below H1’FY26’s 60.6%. Q2’FY27 net profit of Rs 15.34 crore also exceeded Q1’FY27’s Rs 14.5 crore, without offsetting the year-on-year decline.
Got a follow-up? Ask IRIS
What changed in Suyog’s balance sheet by H1’FY27?
Suyog’s consolidated balance-sheet total reached Rs 986.54 crore at H1’FY27, compared with Rs 942.53 crore at FY26 and Rs 683.95 crore at FY25. Shareholders’ fund increased to Rs 507.84 crore from Rs 489.58 crore at FY26. Non-current liabilities rose to Rs 347.01 crore, while current liabilities increased to Rs 131.69 crore.
Non-current financial liabilities were Rs 312.95 crore at H1’FY27, compared with Rs 298.18 crore at FY26 and Rs 130.95 crore at FY25. Current financial liabilities excluding payables were Rs 94.27 crore, up from Rs 76.47 crore at FY26. Trade payables, listed separately by Suyog, fell to Rs 22.23 crore from Rs 38.92 crore.
Property, plant and equipment increased to Rs 377.9 crore at H1’FY27 from Rs 346.46 crore at FY26. Right-of-use assets rose to Rs 237.78 crore from Rs 227.45 crore, while capital work in progress was Rs 87.23 crore against Rs 87.57 crore. These balance-sheet movements coincided with Q2’FY27 depreciation of Rs 17.68 crore, although the presentation does not assign depreciation to individual assets.
What telecom demand opportunities has Suyog identified?
Suyog identified telecom operator expansion as a potential demand driver but did not provide a company revenue target or order value. Vodafone Idea plans Rs 45,000 crore of investment over the next three years, according to the presentation. It had secured a first funding tranche of Rs 6,400 crore, placed equipment orders worth Rs 9,000 crore and incurred Rs 1,930 crore of capital expenditure in the June quarter.
Vodafone Idea plans 3,000 to 3,500 new 4G sites each month, which the presentation links to potential demand for tower infrastructure, power backup, zinc bromide batteries, maintenance and allied services. Suyog describes the operator capex cycle as a multi-year opportunity, but discloses no contract, order book or revenue contribution from Vodafone Idea.
The presentation also cites Bharat Sanchar Nigam Limited’s proposed installation of 16,000 towers by March 2027, comprising 4,000 towers in Mumbai, 6,000 in Delhi and 6,000 in the rest of India. Suyog does not disclose whether it has a role in the programme, the timing of any work or a potential financial value.
Conclusion
Suyog’s Q2’FY27 results show that revenue and EBITDA growth did not translate into higher net profit. Revenue rose 2.8% to Rs 71.7 crore and EBITDA margin reached 60.1%, but depreciation of Rs 17.68 crore and interest expense of Rs 7.65 crore contributed to a 7.7% decline in net profit. The H1’FY27 pattern was similar, with revenue up 4.5% and net profit down 12.1%.
The next disclosures to watch are changes in the Rs 312.95 crore of non-current financial liabilities at H1’FY27 and whether telecom expansion plans cited by Suyog produce identified orders or revenue. The presentation highlights Bharat Sanchar Nigam Limited’s proposed 16,000-tower installation by March 2027, but leaves Suyog’s role and potential value unresolved.