










UFLEX H1 profit after NCI rose 646.5% to Rs 634 crore
Key highlights
- UFLEX H1 FY27 net profit after NCI rose 646.5% to Rs 634 crore.
- UFLEX H1 FY27 revenue from operations increased 31.7% to Rs 10,186.9 crore.
- UFLEX normalized EBITDA margin expanded to 15.5% in H1 FY27 from 11.0% in H1 FY26.
- Packaging films including PET chips contributed 67.0% of Q2 FY27 revenue, versus 63.0% a year earlier.
powered by IRIS
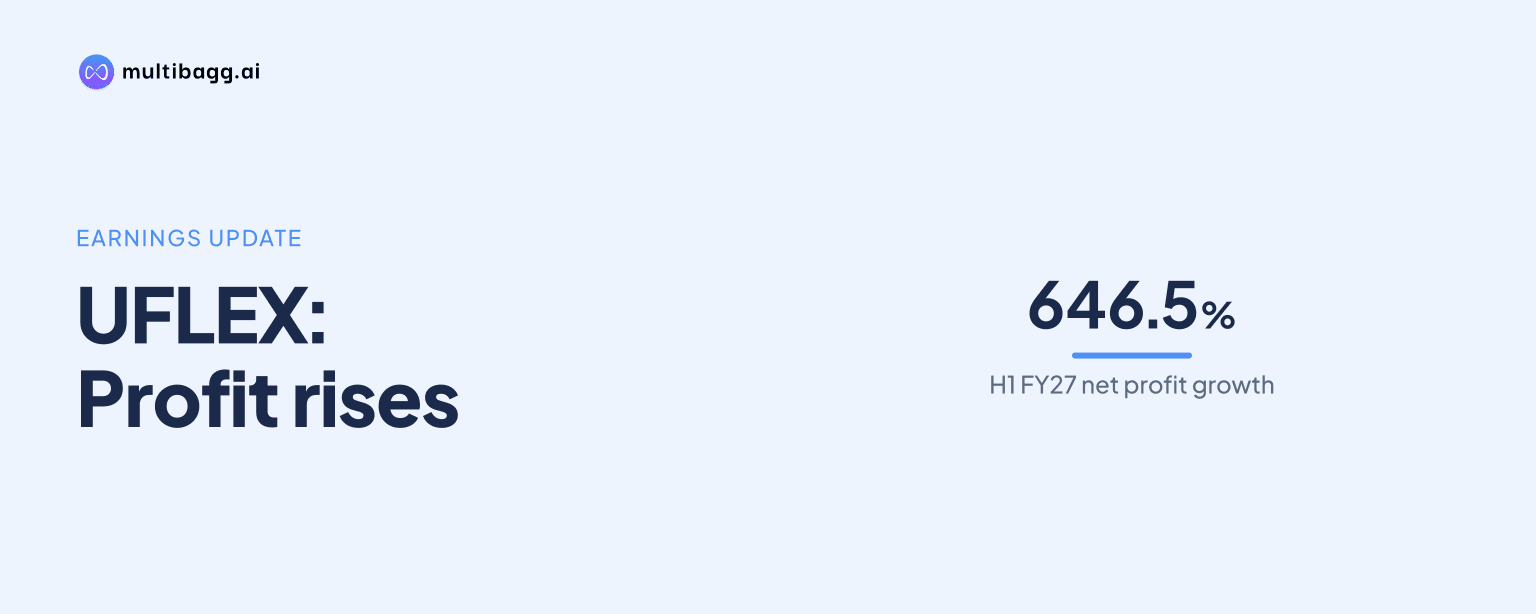
UFLEX reported H1 FY27 net profit after non-controlling interest (NCI) of Rs 634 crore, up 646.5% year on year from Rs 84.9 crore, as revenue from operations rose 31.7% to Rs 10,186.9 crore and normalized earnings before interest, tax, depreciation and amortization (EBITDA) margin increased to 15.5% from 11.0%.
Know Uflex inside out
Results, valuation, peers and who's buying, in one view.
What drove UFLEX's H1 FY27 earnings increase?
UFLEX's H1 FY27 earnings increase reflected higher revenue and a wider normalized EBITDA margin. Revenue from operations rose to Rs 10,186.9 crore from Rs 7,732.6 crore in H1 FY26, while normalized EBITDA increased 85.7% to Rs 1,596.1 crore from Rs 859.3 crore. The normalized EBITDA margin rose 450 basis points to 15.5%; 100 basis points equal one percentage point.
The gain extended below the operating line despite higher depreciation and finance costs. EBITDA increased 81.9% to Rs 1,632.4 crore, depreciation and amortization rose 15.5% to Rs 434.5 crore, and finance costs increased 16.0% to Rs 448.9 crore. Profit before tax reached Rs 749 crore, versus Rs 134.5 crore, while tax expense was Rs 111.8 crore compared with Rs 42.3 crore.
Net profit after NCI grew faster than profit after tax, as the difference between the two measures was Rs 3.2 crore in H1 FY27 versus Rs 7.3 crore a year earlier. The presentation reported no exceptional items in either period. Foreign-exchange currency gains or losses and derivative instruments resulted in a Rs 36.3 crore loss in H1 FY27, compared with a Rs 38.2 crore loss in H1 FY26.
How did UFLEX perform in Q2 FY27?
UFLEX reported Q2 FY27 revenue from operations of Rs 4,820.9 crore, up 25.8% from Rs 3,832 crore in Q2 FY26 but down 10.2% from Rs 5,366 crore in Q1 FY27. Total income rose 26.1% year on year to Rs 4,869.4 crore and declined 9.8% sequentially from Rs 5,397.2 crore.
Q2 normalized EBITDA increased 94.8% year on year to Rs 758.8 crore from Rs 389.5 crore, and the normalized EBITDA margin rose to 15.6% from 10.1%. Normalized EBITDA was 9.4% below Rs 837.3 crore in Q1 FY27, although the margin was 10 basis points above the preceding quarter's 15.5%.
Q2 net profit after NCI was Rs 210.6 crore, up 682.8% from Rs 26.9 crore a year earlier but down 50.2% from Rs 423.3 crore in Q1 FY27. The quarter included a Rs 46.2 crore foreign-exchange and derivative gain, compared with a Rs 82.5 crore loss in Q1 FY27 and a Rs 29.3 crore loss in Q2 FY26. Reported EBITDA was Rs 712.6 crore, up 70.2% year on year and down 22.5% sequentially.
Did packaging films and PET chips account for more revenue?
UFLEX's packaging films business, including polyethylene terephthalate (PET) chips, accounted for 67.0% of Q2 FY27 revenue, compared with 63.0% in Q2 FY26. Packaging represented 23.2%, down from 27.9%; engineering represented 3.1%; and other value-added products accounted for 5.7%. Films and PET chips therefore added 4 percentage points to the revenue mix over the year.
Total packaging-film sales volume increased 4.0% year on year to 265,211 metric tonnes in H1 FY27 from 255,032 metric tonnes. Middle East and Africa volume rose 11.6% to 75,630 tonnes and Americas volume increased 12.0% to 59,267 tonnes. India volume fell 5.2% to 62,180 tonnes, while Europe declined 0.9% to 68,134 tonnes.
PET-chip utilization also increased in Q2 FY27. Consolidated production reached 85,065 tonnes, equal to 88.6% of 96,000 tonnes of capacity, compared with 58,964 tonnes and 61.4% utilization in Q2 FY26. Egypt produced 48,855 tonnes at 90.5% utilization and India produced 36,210 tonnes at 86.2%; consolidated captive sales were 65,008 tonnes and third-party sales were 22,130 tonnes.
Got a follow-up? Ask IRIS
What changed in UFLEX's balance sheet by September 2026?
UFLEX's total assets were Rs 24,750.1 crore on September 30, 2026, compared with Rs 22,171.4 crore on March 31, 2026. Non-current assets increased to Rs 13,841.7 crore, including property, plant and equipment of Rs 9,520 crore. Current assets rose to Rs 10,908.4 crore, including inventories of Rs 3,164.7 crore and trade receivables of Rs 4,397.9 crore.
Total equity rose to Rs 8,722.2 crore from Rs 8,122.4 crore, as other equity increased to Rs 8,650 crore from Rs 8,050.2 crore. Long-term borrowings rose to Rs 6,612.1 crore from Rs 5,821.1 crore, and short-term borrowings increased to Rs 4,110 crore from Rs 4,031.5 crore.
Working-capital balances expanded over the six months. Inventories rose by Rs 756.4 crore, trade receivables increased by Rs 537.1 crore, and trade payables rose by Rs 932.1 crore to Rs 3,391.6 crore. Cash and cash equivalents increased to Rs 1,365.4 crore from Rs 984.4 crore, while capital work-in-progress declined to Rs 2,036.2 crore from Rs 2,169.2 crore.
How does H1 FY27 compare with UFLEX's earlier years?
UFLEX's H1 FY27 profit after NCI of Rs 634 crore exceeded the Rs 317.1 crore reported for the full FY26. Its 6.2% profit-after-tax margin was above FY26's 2.0%, FY25's 0.9%, and FY24's negative 5.1%, but below FY21's 9.5% and FY22's 8.3%.
Normalized EBITDA of Rs 1,596.1 crore in H1 FY27 was below FY26's full-year Rs 1,909.7 crore, while the half-year margin of 15.5% exceeded FY26's 12.3%. H1 FY27 capital expenditure was Rs 1,047.1 crore, compared with Rs 2,042.6 crore for FY26, and sales volume was 337,003 tonnes against 649,789 tonnes for FY26.
The Q2 geographic revenue mix also changed. India represented 45.3% of revenue, down from 47.5% in Q2 FY26, while Middle East and Africa increased to 17.8% from 15.4% and Europe rose to 17.3% from 16.6%. Americas represented 16.9%, compared with 17.6% a year earlier; the presentation defines these shares by point of origin.
Conclusion
UFLEX's H1 FY27 results combined 31.7% revenue growth with a 450-basis-point expansion in normalized EBITDA margin, producing a 646.5% rise in profit after NCI. Packaging films and PET chips became a larger part of Q2 revenue at 67.0%, while packaging-film volume rose 4.0% in H1 and consolidated PET-chip utilization reached 88.6% in Q2.
The next factor to watch is the movement in market prices for films and related inputs shown in the presentation. The 18-micron plain BOPP film market price was Rs 172 per kilogram on November 14, 2026, after Rs 185 per kilogram in September 2026; UFLEX states these market indicators do not represent its actual purchase or sale prices.