










UFlex PET-chip utilisation rose to 88.6% in Q2 FY27
Key highlights
- UFlex produced 85,065 MT of virgin PET chips in Q2 FY27, reaching 88.6% consolidated utilisation.
- Egypt PET-chip production rose 71.2% year on year to 48,855 MT in Q2 FY27.
- Captive PET-chip sales increased to 65,008 MT in Q2 FY27 from 34,252 MT a year earlier.
- Packaging films including PET chips represented 67.0% of UFlex Q2 FY27 revenue from operations.
powered by IRIS
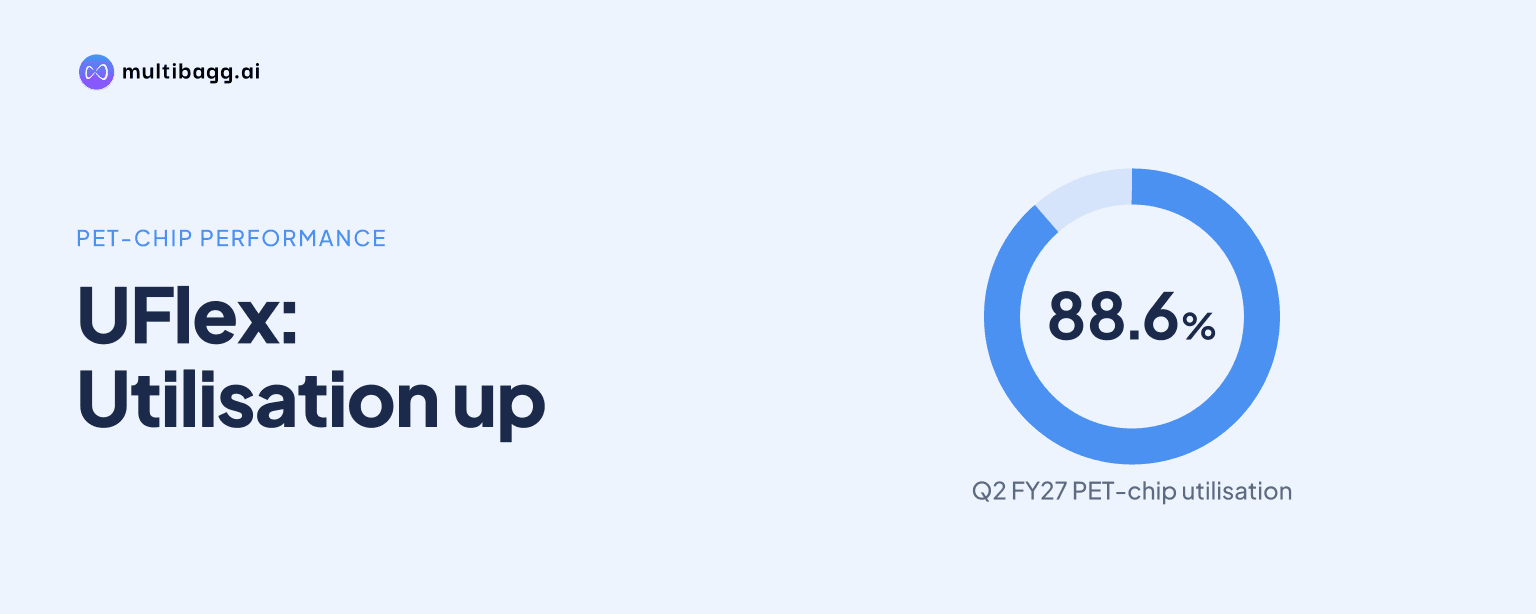
UFlex Limited raised consolidated virgin polyethylene terephthalate, or PET, chip production to 85,065 metric tonnes in Q2 FY27, taking capacity utilisation to 88.6% from 61.4% a year earlier, led by Egypt’s 71.2% year-on-year production increase to 48,855 MT. The higher output also lifted captive consumption to 65,008 MT.
Know Uflex inside out
Results, valuation, peers and who's buying, in one view.
How did UFlex reach 88.6% PET-chip utilisation?
UFlex reached 88.6% consolidated virgin PET-chip utilisation in Q2 FY27 by producing 85,065 MT from quarterly capacity of 96,000 MT across India and Egypt. This was 26,101 MT above Q2 FY26 production of 58,964 MT, when utilisation was 61.4%, and 7,706 MT above Q1 FY27 production of 77,359 MT, when utilisation was 80.6%.
Egypt accounted for most of the year-on-year increase. Its production rose to 48,855 MT in Q2 FY27, or 90.5% of its 54,000-MT quarterly capacity, from 28,542 MT and 52.9% utilisation in Q2 FY26. The 20,313-MT increase represented 71.2% year-on-year growth. Egypt contributed 57.4% of consolidated PET-chip production in Q2 FY27, compared with 48.4% a year earlier.
India produced 36,210 MT in Q2 FY27, representing 86.2% utilisation of 42,000 MT of quarterly capacity. Output was 5,788 MT, or 19.0%, above Q2 FY26 production of 30,422 MT, although it was 568 MT below the 36,778 MT produced in Q1 FY27. Higher Egyptian output alongside sustained Indian production increased consolidated utilisation by 8 percentage points sequentially.
Why did PET-chip integration matter in Q2 FY27?
PET-chip integration mattered because UFlex reported that geopolitical disruption in West Asia created monoethylene glycol, or MEG, shortages, increasing virgin PET-chip input costs and restricting finished-goods availability in Q2 FY27. UFlex said its integrated Panipat operations and domestic purified terephthalic acid, or PTA, and MEG sourcing from Indian Oil Corporation Limited, or IOCL, supported feedstock security and supply continuity.
The group directed more chip output into internal operations. Captive sales were 65,008 MT in Q2 FY27, compared with 34,252 MT in Q2 FY26 and 47,002 MT in Q1 FY27. That was a 30,756-MT year-on-year increase, while third-party sales rose to 22,130 MT from 20,881 MT a year earlier.
Egypt was the main source of captive use, recording 47,359 MT of captive sales in Q2 FY27, equivalent to about 97% of its 48,855-MT production. Its third-party sales were 3,514 MT, against 475 MT in Q2 FY26. India reported 17,649 MT of captive sales and 18,616 MT of third-party sales, giving it a more balanced outlet mix than Egypt in the quarter.
What changed in UFlex’s PET-chip sales mix?
UFlex’s PET-chip sales mix shifted towards captive consumption in Q2 FY27, with captive sales of 65,008 MT against third-party sales of 22,130 MT. In Q1 FY27, captive sales were 47,002 MT and third-party sales were 29,471 MT, meaning internal consumption increased by 18,006 MT while third-party sales declined by 7,341 MT sequentially.
In India, captive sales increased to 17,649 MT from 10,985 MT in Q2 FY26, while third-party sales declined to 18,616 MT from 20,406 MT. Egypt’s captive sales more than doubled from 23,267 MT to 47,359 MT over the same comparison. The presentation reports production of 85,065 MT and combined captive and third-party sales of 87,138 MT for Q2 FY27, but does not explain the difference.
The internal demand is relevant to UFlex’s wider business mix. Packaging films, including PET chips, generated 67.0% of Q2 FY27 revenue from operations, compared with 63.0% in Q2 FY26. UFlex reported that Packaging Films and PET Chips accounted for 83% of the Rs 1,008.4 crore incremental total-income increase during the quarter, as total income rose 26.1% year on year to Rs 4,869.4 crore.
Got a follow-up? Ask IRIS
How did output differ across UFlex’s manufacturing network?
UFlex’s packaging-film plants produced 135,778 metric tonnes per quarter, or MTPQ, in Q2 FY27, equal to 85.37% utilisation of 159,040 MTPQ capacity. This was almost unchanged from 135,873 MTPQ in Q1 FY27 but 12.5% above Q2 FY26 production of 120,644 MTPQ, when utilisation was 75.9%.
The geographic trends in film production differed from the PET-chip operations. Packaging-film production in Egypt was 26,043 MT in Q2 FY27, down 11.7% sequentially from 29,491 MT, but up 29.0% year on year from 20,184 MT. India’s packaging-film output rose 15.8% sequentially to 35,372 MT, while Mexico’s increased 10.4% to 17,102 MT. These figures measure packaging films rather than PET chips, but both datasets identify Egypt and India as important production locations.
The Middle East and Africa, or MEA, region recorded 36,144 MT of packaging-film sales in Q2 FY27, an 8.2% year-on-year increase. UFlex attributed regional demand recovery to a Q1 FY27 inventory build-up, July destocking and a preference for domestic sourcing during the West Asia crisis. The company identified Egypt and Turkey as beneficiaries of regional volume growth, although it did not disclose Egypt-specific packaging-film sales.
What capacity and demand developments should be tracked next?
UFlex had virgin PET-chip capacity of 384,000 metric tonnes per annum, or MTPA, as of December 2025, including 168,000 MTPA in India and 216,000 MTPA in Egypt. It also reported 79,020 MTPA of recycled PET-chip capacity, comprising 46,020 MTPA in India, 18,000 MTPA in Egypt and 15,000 MTPA in Mexico. These capacities place the Q2 FY27 output increase within a broader resin manufacturing network.
Management said it remained confident of delivering growth in FY27, supported by recently commissioned facilities and an upcoming aseptic-packaging facility in Egypt. The Ain Sokhna greenfield aseptic project has annual capacity of 12 billion carton packs and was scheduled for commissioning in H2 FY27. As of Q2 FY27, UFlex had incurred Rs 1,057.8 crore of its planned Rs 1,209.3 crore capital expenditure on that project, leaving Rs 151.6 crore of residual spending.
Conclusion
UFlex’s 88.6% consolidated PET-chip utilisation in Q2 FY27 reflected substantially higher output, particularly at the Egyptian operation, where production rose 71.2% year on year. Captive sales increased to 65,008 MT from 34,252 MT, showing the role of India and Egypt resin plants in supplying internal requirements while the company reported MEG shortages and constrained chip availability.
The next points to watch are whether Egypt sustains 90.5% PET-chip utilisation, whether the mix between captive and third-party sales changes further, and progress at the 12-billion-carton-pack Ain Sokhna aseptic project scheduled for H2 FY27. Management also cited the commissioned Noida recycling plant and Mexico WPP bags facility as FY27 growth supports, while raw-material availability remained an unresolved operating factor.