










UFlex Q2 normalized EBITDA rises 95% as margin reaches 15.6%
Key highlights
- UFlex reported Q2 FY27 normalized EBITDA of Rs 758.8 crore, up 94.8% year on year.
- UFlex’s Q2 FY27 normalized EBITDA margin increased 550 basis points year on year to 15.6%.
- UFlex’s Q2 FY27 normalized PAT rose 682.8% year on year to Rs 210.6 crore.
- UFlex incurred capital expenditure of Rs 1,047.1 crore in H1 FY27.
powered by IRIS
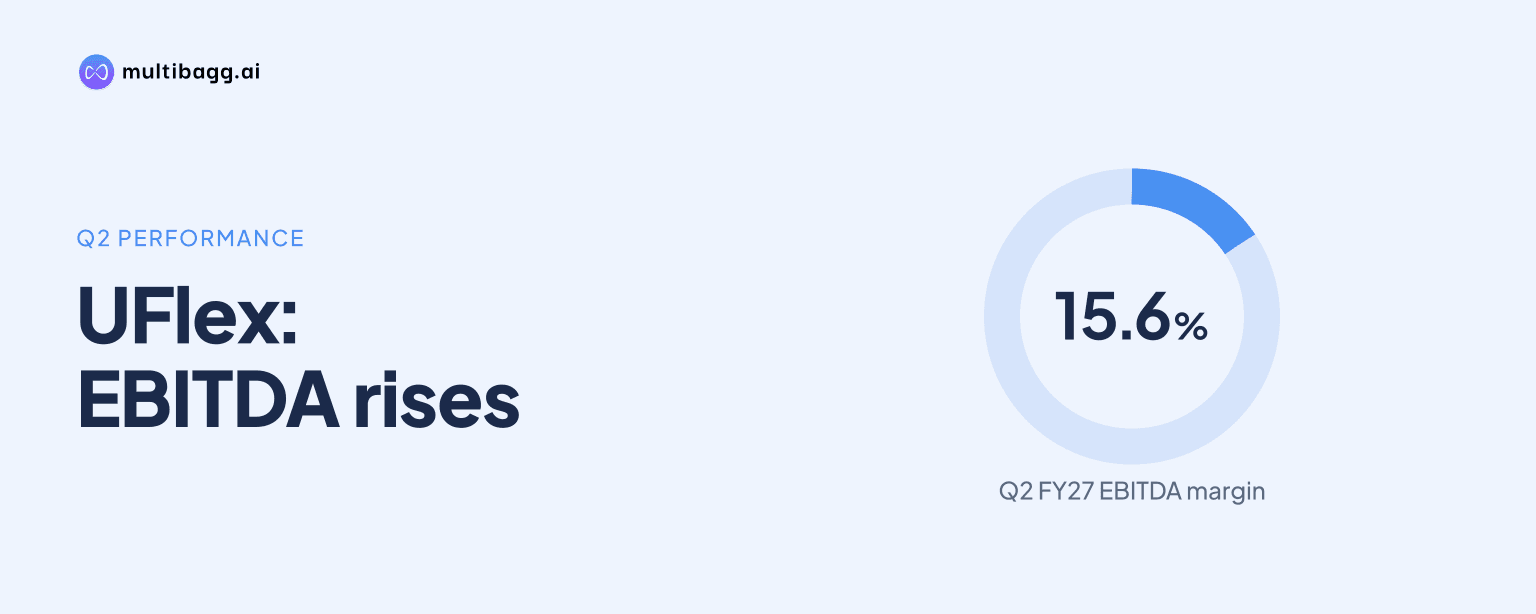
UFlex Limited reported normalized EBITDA of Rs 758.8 crore in the second quarter of fiscal year 2027 (Q2 FY27), up 94.8% year on year, as its margin widened 550 basis points to 15.6%; management cited higher realisations, a better product mix and spread expansion, while sales volume rose 1.5% to 163,532 metric tonnes.
Know Uflex inside out
Results, valuation, peers and who's buying, in one view.
Why did UFlex’s Q2 profitability rise faster than revenue?
UFlex’s normalized EBITDA rose 94.8% year on year in Q2 FY27, against revenue growth of 26.1%, because management cited higher realisations, a better product mix and spread expansion. Normalized EBITDA reached Rs 758.8 crore on revenue of Rs 4,869.4 crore. The resulting 15.6% normalized EBITDA margin was 550 basis points above a year earlier; one basis point is one-hundredth of a percentage point.
The improvement also extended to normalized profit after tax (PAT), which increased 682.8% year on year to Rs 210.6 crore in Q2 FY27. Normalized PAT margin was 4.3%, up 360 basis points from the prior-year quarter. UFlex identified Egypt, India, Mexico, Nigeria and Hungary as the major contributors to incremental EBITDA, showing that several operations contributed to the disclosed increase.
How did UFlex perform in the first half of FY27?
UFlex reported Rs 1,596.1 crore of normalized EBITDA in the first half of fiscal year 2027 (H1 FY27), up 85.7% year on year, on revenue of Rs 10,266.6 crore, up 31.9%. The H1 FY27 normalized EBITDA margin was 15.5%, 450 basis points above the prior-year period. The Q2 FY27 margin of 15.6% was 10 basis points above the H1 FY27 level.
Normalized PAT reached Rs 634.0 crore in H1 FY27, a 646.5% year-on-year increase, with a 6.2% margin that was 510 basis points higher. On a reported rather than normalized basis, EBITDA was Rs 712.6 crore in Q2 FY27 at a 14.6% margin and Rs 1,632.4 crore in H1 FY27 at a 15.9% margin. The presentation says the normalized EBITDA adjustment reflected foreign-exchange and derivative losses of Rs 46.2 crore in Q2 FY27 and gains of Rs 36.3 crore in H1 FY27.
What drove UFlex revenue growth in Q2 FY27?
UFlex added Rs 1,008.4 crore of revenue in Q2 FY27, with Packaging Films and PET Chips accounting for 83% of incremental revenue. Revenue in that business rose 34.3% year on year, ahead of consolidated growth of 26.1%. Packaging Solutions rose 5.2% and supplied 5.5% of incremental revenue, while Engineering rose 36.2% and Other Value-Added Products rose 28.2%.
Sales volume rose 1.5% year on year to 163,532 metric tonnes in Q2 FY27, a smaller increase than revenue growth. Packaging Films represented 78.9% of total volume and increased 3.0%, while Packaging Solutions accounted for 21.1% and declined 3.9%. The difference between volume growth and revenue growth is consistent with management’s stated explanation that realisations and product mix, rather than tonnes alone, contributed to earnings growth.
Got a follow-up? Ask IRIS
Which markets and products supported UFlex’s Q2 results?
UFlex said Packaging Films volume growth was led by the Middle East and Africa (MEA) at 8.2% year on year, the Americas at 5.9%, and India at 0.5%; Indian film volume was also 12.1% higher quarter on quarter. Domestic markets supplied 45% of Q2 FY27 revenue and international markets supplied 55%. In H1 FY27, international markets represented 58% of revenue, compared with 42% for domestic markets.
UFlex Europe sales increased 31% year on year despite what the presentation described as a softer local market, while localized sourcing supported steady United States volume growth amid nearshoring trends and West Asia transit disruption. In MEA, the presentation describes a Q1 FY27 inventory build-up, July destocking and subsequent demand recovery. It says Egypt and Turkey benefited from a preference for domestic sourcing during the West Asia crisis, while lower imports supported Q2 FY27 packaging-film demand in India.
Virgin PET Chips contributed through higher realisations for SSP-grade bottle-grade chips. Management said monoethylene glycol (MEG) shortages linked to the West Asia crisis increased Virgin PET Chip input costs and constrained finished-goods availability. It added that UFlex’s integrated Panipat operations and domestic purified terephthalic acid (PTA) and MEG sourcing from Indian Oil Corporation Limited supported feedstock security and supply continuity.
What capacity additions could affect UFlex after Q2 FY27?
UFlex incurred capital expenditure of Rs 568.9 crore in Q2 FY27, after Rs 478.2 crore in Q1 FY27, taking H1 FY27 capital expenditure to Rs 1,047.1 crore. Net debt was Rs 9,039.0 crore at Q2 FY27. The Noida Sector 155 recycling project, with annual capacity of 39,600 metric tonnes, was commissioned on May 1, 2026 after Rs 316.0 crore of its Rs 317.1 crore planned outlay had been incurred.
Management said the commissioned Noida recycling plant and the WPP bags facility in Mexico form part of its FY27 growth plan, alongside an aseptic packaging facility in Egypt scheduled for H2 FY27. The Ain Sokhna greenfield aseptic project is planned to produce 12 billion carton packs annually; Rs 1,057.8 crore had been spent by Q2 FY27, leaving Rs 151.6 crore of residual capital expenditure. A Dharwad brownfield biaxially oriented polypropylene (BOPP) line with annual capacity of 54,000 metric tonnes is scheduled for FY27-28.
Conclusion
The disclosed results show that UFlex’s earnings expansion outpaced both revenue and sales-volume growth in Q2 FY27: revenue rose 26.1%, volume rose 1.5%, and normalized EBITDA increased 94.8%. Management attributed that difference to higher realisations, product mix and spread expansion, with incremental EBITDA contributions identified across Egypt, India, Mexico, Nigeria and Hungary.
The next disclosed milestones are the H2 FY27 commissioning schedule for the Egypt aseptic project and the FY27-28 schedule for the Dharwad BOPP line. Management expects the ramp-up of recently commissioned facilities, a higher-value-added portfolio, operational efficiencies and improved mix to support FY27 growth, while volatile raw-material prices, geopolitical disruption and lower-priced aseptic packaging imports remain identified operating factors.