










Zetwerk Guides FY27 EBITDA Growth to Outpace Revenue Growth
Key highlights
- Zetwerk guided for FY27 revenue growth of 25%-30% and adjusted EBITDA growth of 60%-70%.
- H1 FY27 revenue rose 33% year on year, while adjusted EBITDA increased 70%.
- Q2 FY27 adjusted EBITDA was Rs 171 crore, up 66% from Q1 FY27.
- Manufacturing gross margin reached 25.5% in Q2 FY27, versus 23% in Q1 FY27.
powered by IRIS
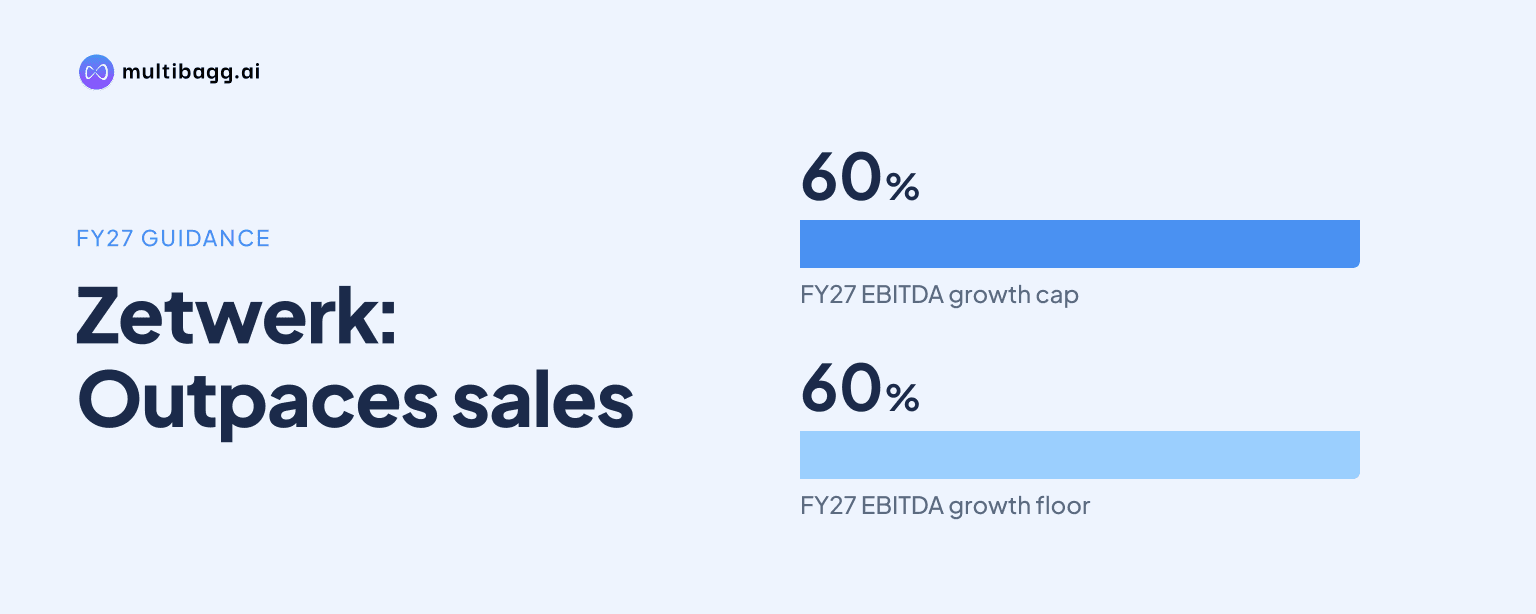
Zetwerk Manufacturing Businesses Limited expects adjusted EBITDA growth of 60%-70% in FY27, more than twice its guided 25%-30% revenue growth, after H1 FY27 revenue rose 33% year on year and adjusted EBITDA increased 70%. Management attributed the expected gap to operating leverage and a greater contribution from higher-margin manufacturing, international work and selected products.
Know Zetwerk Manufacturing Businesses inside out
Results, valuation, peers and who's buying, in one view.
What is Zetwerk's FY27 growth guidance?
Zetwerk has guided for FY27 revenue growth of 25%-30% and adjusted EBITDA growth of 60%-70%. Adjusted EBITDA is earnings before interest, tax, depreciation and amortisation adjusted for non-cash employee stock-option plan expense. Management cited FY26 adjusted EBITDA of Rs 420 crore as the base for its full-year growth outlook.
The guidance follows H1 FY27, when revenue increased 33% from H1 FY26 and adjusted EBITDA rose 70%. Management said it expects similar momentum through the full year, while noting that the second half is usually larger than the first half. In FY26, H1 accounted for 40% of annual revenue and 40% of adjusted EBITDA.
Operating cash flow remained negative in Q2 FY27, but improved by almost 67% from Q1 FY27, according to management. On an H1 basis, operating cash flow improved by about 50% from H1 FY26, while working capital was around 30 days. These measures provide context for the earnings-growth guidance, which is based on margin expansion rather than revenue alone.
Why does Zetwerk expect EBITDA to grow faster than revenue?
Zetwerk expects adjusted EBITDA to grow faster than revenue because management does not expect its existing cost base to rise at the same pace as gross profit. Management described software engineering and product and design engineering costs as largely upfront people costs that were built over the company’s eight-year development and can create operating leverage as revenue increases.
In Q2 FY27, revenue increased 12% quarter on quarter, while gross profit rose 39% from Q1 FY27. Overall gross margin reached almost 15%, compared with 12% in Q1 FY27 and 13% in Q2 FY26. Adjusted EBITDA was Rs 171 crore, up 66% quarter on quarter.
Management said the intended financial pattern is for gross profit to increase faster than revenue and for EBITDA to rise faster than gross profit. That outcome depends on continued gross-margin expansion through changes in fulfilment model, geographic sales and product mix, rather than solely on a larger revenue base.
Which segment is driving Zetwerk's margin expansion?
Zetwerk's manufacturing business is driving the reported margin expansion, with H1 FY27 revenue of Rs 4,448 crore and gross margin of about 25%. The segment generated Rs 2,500 crore of revenue in Q2 FY27, 34% above Q1 FY27, as management said higher-margin segments made up a larger portion of sales.
The manufacturing business reported a Q2 FY27 gross margin of 25.5%, compared with 23% in Q1 FY27 and 22% in the comparable quarter a year earlier. Segment EBITDA margin rose to 8.3% in Q2 FY27 from 6.6% in Q1 FY27, reflecting the increased gross-profit contribution cited by management.
Zetwerk's ecosystem segment supplies raw materials and carries a 2%-3% gross margin, according to management. The difference from the manufacturing business is relevant because the company's margin plan rests on expanding higher-value manufacturing activity rather than generating similar profitability across all revenue streams.
Got a follow-up? Ask IRIS
How do captive production and international sales affect Zetwerk margins?
Zetwerk reported higher H1 FY27 gross margins in both captive production and its marketplace model, while international sales remained more profitable than India sales. Captive production refers to manufacturing in Zetwerk's own factories, while the marketplace model uses third-party manufacturing partners.
International sales recorded a 32% H1 FY27 gross margin, against 19% for India sales. International markets accounted for 41% of H1 FY27 revenue, compared with 30% in FY26. Management identified the larger international contribution as one of the factors supporting the company's margin outlook.
Captive factories fulfilled 60% of H1 FY27 revenue, while marketplace partners fulfilled 40%. Management cautioned that the H1 division is not a steady-state mix, as marketplace fulfilment is expected to represent a larger share in H2 when related revenue is recognised.
What must Zetwerk achieve to reach its gross-margin target?
Zetwerk's stated objective is to approach a 25% gross margin on a full-year basis, after reaching almost 15% overall gross margin in Q2 FY27 and 25.5% in its manufacturing business. Management described the plan as a 3M model: mix, market and model.
Mix includes products such as space and defence, which management described as higher-margin categories. Market refers to international sales, where H1 FY27 gross margin was 32%. Model refers to captive production, which reported a 25% H1 FY27 gross margin, compared with 24% for the marketplace model.
The manufacturing revenue mix in H1 FY27 was led by energy at 64%, followed by precision at almost 22% and capital goods at 14%. Energy includes solar panels, wind-turbine components and transformers, while precision includes defence, electronics and mechanical parts. The target therefore requires margin progress within a business still led by energy.
Zetwerk said 76% of H1 FY27 revenue came from recurring build-to-print components, where the customer provides the design, while 24% came from products that Zetwerk designs and manufactures itself. Management linked own-design work to higher-margin activity, making the future share of this revenue category relevant to gross-profit growth.
Conclusion
Zetwerk's FY27 guidance sets out a material difference between expected revenue growth of 25%-30% and adjusted EBITDA growth of 60%-70%. H1 FY27, with revenue growth of 33% and adjusted EBITDA growth of 70%, supports management's view that manufacturing margins and operating leverage can lift profit faster than sales, although the ecosystem segment retains a lower 2%-3% gross margin.
The next measure to watch is whether Zetwerk converts Q2 FY27 overall gross margin of almost 15% and manufacturing gross margin of 25.5% into progress toward its close-to-25% full-year target. Management also expects H2 to exceed H1 and marketplace fulfilment to take a larger share of H2 revenue, making the second-half revenue and fulfilment mix important to the FY27 outcome.