










Aelea H1 revenue rose 42% while PAT slipped on deferred tax
Key highlights
- Aelea’s H1 FY27 revenue from operations rose 42.06% to Rs 246.7396 crore.
- Aelea’s H1 FY27 EBITDA increased 52.87% to Rs 23.3103 crore, while margin rose to 9.45% from 8.78%.
- Aelea’s H1 FY27 PAT declined to Rs 8.6353 crore from Rs 8.7021 crore as deferred tax rose to Rs 90 lakh.
- Aelea reported total borrowings of Rs 232.72 crore in H1 FY27 and finance cost of Rs 8.3948 crore.
powered by IRIS
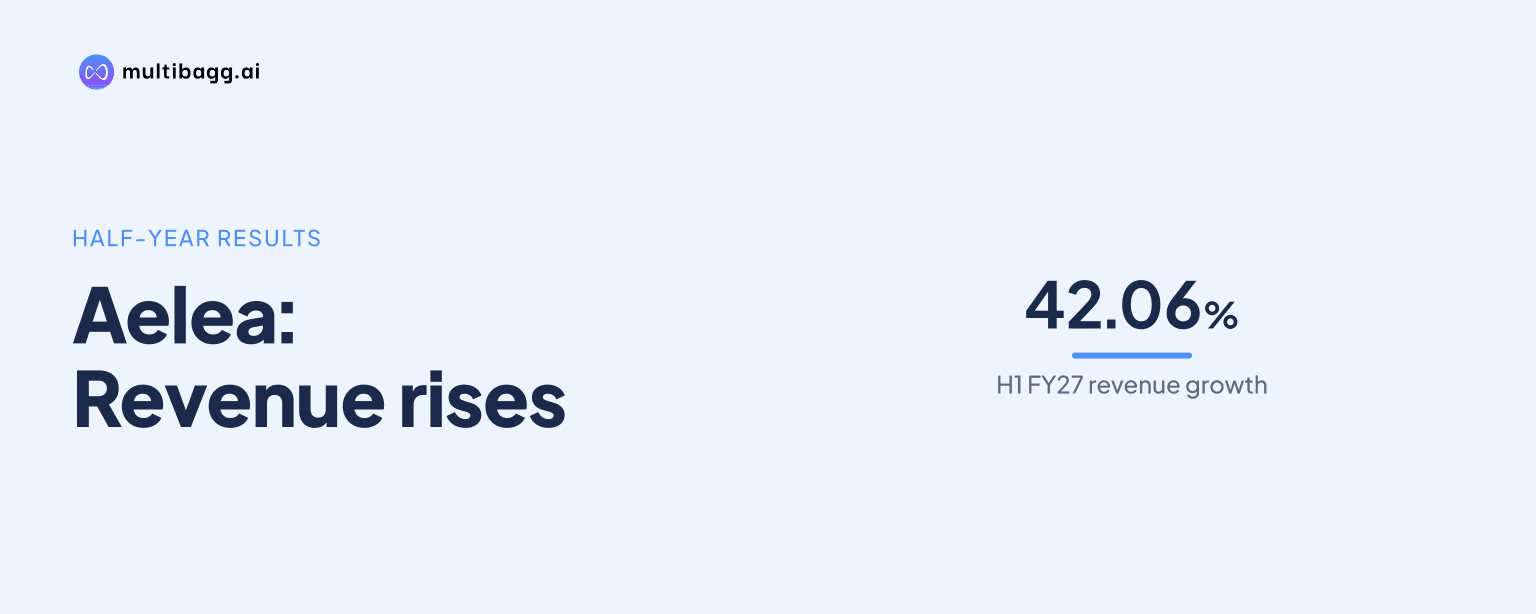
Aelea Commodities Limited lifted H1 FY27 revenue 42.06% year on year to Rs 246.7396 crore and EBITDA 52.87% to Rs 23.3103 crore, while profit after tax fell to Rs 8.6353 crore from Rs 8.7021 crore as deferred tax rose, according to its investor presentation.
Know Aelea Commodities inside out
Results, valuation, peers and who's buying, in one view.
How did Aelea perform in H1 FY27?
Aelea increased revenue and EBITDA in H1 FY27, while reported profit after tax, or PAT, was marginally lower than in H1 FY26. Revenue from operations rose by Rs 73.0468 crore from Rs 173.6928 crore in H1 FY26 to Rs 246.7396 crore in H1 FY27. Earnings before interest, tax, depreciation and amortisation, or EBITDA, increased by Rs 8.0622 crore to Rs 23.3103 crore.
Aelea’s EBITDA grew faster than revenue, at 52.87% against 42.06%, and its EBITDA margin rose to 9.45% from 8.78%. The 66.86-basis-point change means an increase of 66.86 hundredths of a percentage point. In contrast, PAT declined by Rs 6.68 lakh, PAT margin fell to 3.50% from 5.01%, and earnings per share moved to Rs 4.24 from Rs 4.27.
Why did Aelea’s PAT decline despite higher EBITDA?
Aelea’s PAT declined because the increase in deferred tax exceeded the year-on-year increase in profit before tax, or PBT, in the figures it presented. PBT rose 0.9% to Rs 1,254 lakh in H1 FY27 from Rs 1,243 lakh in H1 FY26, an increase of Rs 11 lakh. Current tax declined by Rs 5 lakh, but deferred tax increased by Rs 22 lakh to Rs 90 lakh.
Total current and deferred tax was Rs 390 lakh in H1 FY27, compared with Rs 373 lakh in H1 FY26, an increase of Rs 17 lakh. That increase was greater than the Rs 11 lakh rise in PBT, resulting in PAT of Rs 8.6353 crore rather than Rs 8.7021 crore a year earlier. Management said underlying operational earning power remained intact year on year and attributed the net-profit variation primarily to deferred-tax accounting; the presentation does not identify the specific deferred-tax asset or liability involved.
Did higher borrowing increase Aelea’s finance cost?
Aelea reported that finance cost was broadly stable even as total borrowings more than doubled across the periods compared. Total borrowings were Rs 232.72 crore in H1 FY27 versus Rs 111.26 crore in H2 FY26. Finance cost was Rs 8.3948 crore in H1 FY27, compared with Rs 8.3617 crore in H2 FY26, an increase of Rs 3.31 lakh.
Aelea said short-term borrowings increased to Rs 229.7835 crore in H1 FY27 from Rs 107.5065 crore as of March 31, 2026, to fund working capital and inventory. Management said debt was raised dynamically near the end of the period for raw-material and inventory float, and said this did not result in a sustained annualised burden on finance expense. The presentation does not disclose interest rates, maturities or the mix of the total borrowings.
Got a follow-up? Ask IRIS
How do cashew prices affect Aelea’s EBITDA margin?
Aelea says cashew-price movements can change percentage EBITDA margin without changing absolute EBITDA per kilogram under its stated pricing mechanism. Its revenue structure consists of a raw-cashew component passed through at market prices and a value-addition component fixed per kg. A higher cashew price increases reported revenue and therefore expands the denominator in the EBITDA-margin calculation.
In Aelea’s illustration, value addition is Rs 27 per kg and operating cost is Rs 20 per kg, leaving EBITDA of Rs 7 per kg. At cashew prices of Rs 150, Rs 175 and Rs 200 per kg, illustrated EBITDA remains Rs 7 per kg. However, EBITDA margin falls from 4.67% to 4.00% and then 3.50% as the cashew-price component rises.
The same mechanism works in reverse in Aelea’s example: a lower cashew price reduces revenue and improves percentage EBITDA margin, while illustrated EBITDA per kg remains unchanged. Aelea reported a 9.45% EBITDA margin in H1 FY27, compared with 8.78% in H1 FY26, but did not disclose the raw-cashew price movement behind that 66.86-basis-point increase. The example therefore explains possible margin mechanics rather than establishing the cause of the reported year-on-year change.
What does the H1 FY27 comparison show about reported profitability?
Aelea’s H1 FY27 comparison shows operating growth that was not fully reflected in after-tax earnings. Revenue rose by Rs 73.0468 crore and EBITDA by Rs 8.0622 crore, while PBT increased by Rs 11 lakh and PAT decreased by Rs 6.68 lakh. The difference reflects both the reported tax movement and the fact that EBITDA, PBT and PAT measure different stages of profitability.
The presentation also separates percentage margins from per-kg profitability in its cashew model. Its illustrative Rs 7 per kg EBITDA is unchanged across raw-cashew prices of Rs 150, Rs 175 and Rs 200 per kg, even though the corresponding percentage margins differ. That distinction means percentage revenue and margin movements should be read alongside the company’s disclosed pass-through structure.
Conclusion
Aelea reported faster growth in operating profit than in revenue in H1 FY27, with EBITDA up 52.87% to Rs 23.3103 crore and revenue up 42.06% to Rs 246.7396 crore. PAT nevertheless declined to Rs 8.6353 crore because deferred tax rose to Rs 90 lakh, while PBT increased by Rs 11 lakh. Its cashew illustration further shows why a percentage EBITDA margin can move independently of illustrative EBITDA per kg.
The next disclosed event is Aelea’s virtual post-results earnings conference call, scheduled for November 4, 2026 at 11:00 a.m., following the November 3 investor-presentation filing. The points to watch are management’s explanation of the deferred-tax movement and the period-end working-capital funding, after short-term borrowings reached Rs 229.7835 crore in H1 FY27.