










Borana Weaves FY22-FY26 revenue rose 9.2 times, margin doubled
Key highlights
- Borana Weaves' FY26 revenue from operations was Rs 388.5931 crore, versus Rs 42.334 crore in FY22.
- Borana Weaves' EBITDA margin rose from 12% in FY22 to 24% in FY26.
- Borana Weaves generated Rs 44.4013 crore of operating cash flow in FY26 after an Rs 8.3262 crore outflow in FY22.
- Borana Weaves' debt-to-equity ratio declined from 1.45 in 2024 to 0.25 in 2026.
powered by IRIS
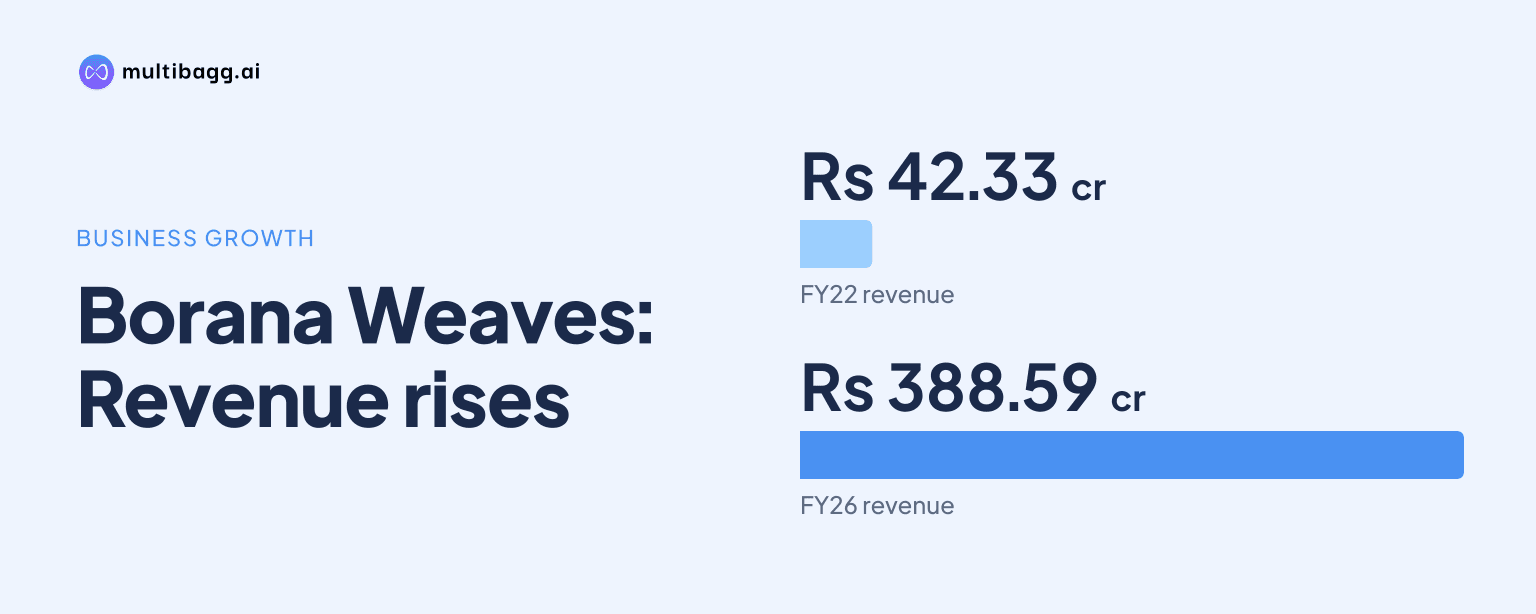
Borana Weaves Limited lifted revenue from operations to Rs 388.5931 crore in FY26 from Rs 42.334 crore in FY22, a 9.2-times increase, while earnings before interest, tax, depreciation and amortisation (EBITDA) margin doubled to 24% from 12%. Over the same period, operating cash flow turned from an outflow of Rs 8.3262 crore to an inflow of Rs 44.4013 crore.
Know Borana Weaves inside out
Results, valuation, peers and who's buying, in one view.
How quickly did Borana Weaves grow revenue between FY22 and FY26?
Borana Weaves expanded revenue from operations in every year from FY22 to FY26, reaching Rs 388.5931 crore in FY26 from Rs 42.334 crore in FY22. The presentation reports a four-year compound annual growth rate (CAGR) of 74.06% for revenue, with the FY22 figure designated as the base year. Revenue first rose to Rs 135.399 crore in FY23, then increased to Rs 199.0556 crore in FY24 and Rs 290.3104 crore in FY25 before the FY26 result.
The annual increases became smaller in percentage terms as the revenue base rose, but the absolute additions continued. Revenue increased by Rs 93.065 crore between FY22 and FY23, by Rs 63.6566 crore between FY23 and FY24, by Rs 91.2548 crore between FY24 and FY25, and by Rs 98.2827 crore in FY26. The FY26 increase was the largest annual rupee addition in the five-year series, even though the presentation provides no segment-wise revenue split or explanation for the annual expansion.
How did Borana Weaves' profitability change as sales expanded?
Borana Weaves increased EBITDA from Rs 5.1746 crore in FY22 to Rs 91.5171 crore in FY26, while its EBITDA margin rose from 12% to 24%. EBITDA therefore grew faster than revenue, and the company reports a four-year EBITDA CAGR of 105.07%, compared with the 74.06% revenue CAGR. The margin advanced by 7 percentage points in FY23 to 19%, followed by 2 percentage points in FY24, 1 percentage point in FY25 and 2 percentage points in FY26.
Profit after tax (PAT) rose from Rs 1.7986 crore in FY22 to Rs 64.6562 crore in FY26, according to the presentation's 144.86% four-year PAT CAGR. PAT margin increased from 4% in FY22 to 12% in FY23, remained at 12% in FY24, and then moved to 14% in FY25 and 17% in FY26. This means the reported net-margin increase over the full period was 13 percentage points, compared with the 12-percentage-point gain in EBITDA margin.
The FY26 results show that the difference between EBITDA and PAT remained material in rupee terms: EBITDA was Rs 91.5171 crore and PAT was Rs 64.6562 crore. The presentation does not provide a full-year FY22-to-FY26 bridge for finance cost, depreciation or tax that would identify the drivers of that gap. It does, however, show a consistent annual progression in both reported operating profit and PAT from FY22 through FY26.
Got a follow-up? Ask IRIS
Did Borana Weaves convert growth into operating cash flow and lower leverage?
Borana Weaves reported positive cash flow from operations from FY23 onward after recording an operating cash outflow of Rs 8.3262 crore in FY22. Operating cash flow was Rs 6.896 crore in FY23, Rs 22.4577 crore in FY24, Rs 22.6403 crore in FY25 and Rs 44.4013 crore in FY26. The FY26 inflow was almost double the FY25 figure and was reported alongside FY26 PAT of Rs 64.6562 crore.
The debt-to-equity ratio declined to 0.25 in 2026 from 1.45 in 2024, after falling to 0.67 in 2025. Over the same three years, the current ratio rose from 1.32 to 2.62 and then 4.33. Inventory turnover was 7.23 times in 2024, decreased to 5.56 times in 2025, and returned to 7.23 times in 2026, indicating that the presentation shows a temporary change in that ratio rather than a one-direction trend.
These measures describe a different trajectory from the FY22 operating cash outflow, but the presentation does not provide historic borrowings in rupees for FY22 through FY26. It therefore supports a comparison of the reported leverage ratios, not a calculation of the amount of debt repaid over that interval. The available data show lower debt relative to equity in 2026 and higher reported operating cash generation in FY26.
What do the latest half-year figures say about the FY26 trend?
Borana Weaves recorded revenue from operations of Rs 239.0403 crore in H1 FY27, up 35.44% from Rs 176.4962 crore in H1 FY26, while EBITDA increased 31.94% to Rs 51.2151 crore. First-half EBITDA margin, however, was 21.43%, below 21.99% a year earlier and below the 24% reported for FY26. PAT grew 13.04% to Rs 32.6395 crore, while PAT margin declined to 13.65% from 16.36%.
The presentation attributes the latest pressure to delayed partially oriented yarn (POY) imports, which led to domestic procurement costs that were 30% to 40% higher. It says orders had been pre-booked at predetermined prices, limiting immediate cost pass-through. In Q2 FY27, EBITDA margin was 18.36%, compared with 25.63% in Q1 FY27 and 22.68% in Q2 FY26, while PAT margin was 11.69%, versus 16.34% and 17.47%, respectively.
Management states that the company generally passes cost increases on to customers quarter on quarter, which it says could help ease the pressure in coming quarters. That is a management-described mechanism rather than a forecast of a specific margin result. Finance costs in H1 FY27 were Rs 1.4194 crore, down from Rs 1.8799 crore in H1 FY26, while depreciation and amortisation rose to Rs 12.0923 crore from Rs 6.9712 crore.
Conclusion
The FY22-to-FY26 record shows that Borana Weaves combined a rise in revenue from Rs 42.334 crore to Rs 388.5931 crore with EBITDA-margin expansion from 12% to 24% and PAT-margin expansion from 4% to 17%. Operating cash flow moved from negative Rs 8.3262 crore in FY22 to positive Rs 44.4013 crore in FY26, while the debt-to-equity ratio fell from 1.45 in 2024 to 0.25 in 2026.
The next disclosed issue to watch is whether POY procurement costs and the company’s quarter-on-quarter customer pass-through mechanism affect profitability after H1 FY27. Revenue was up 35.44% in the half year, but EBITDA margin was 21.43% and fell further to 18.36% in Q2 FY27, below the FY26 margin of 24%.