










Great Eastern Shipping normalised Q2 profit rises to Rs 1,213 crore
Key highlights
- Great Eastern Shipping’s normalised consolidated Q2 FY27 net profit rose to Rs 1,213 crore from Rs 525 crore in Q2 FY26.
- Reported consolidated Q2 FY27 net profit was Rs 1,269 crore, versus Rs 581 crore a year earlier.
- Great Eastern Shipping booked Rs 308 crore of profit on ship and other asset sales in Q2 FY27.
- Normalised consolidated gross debt fell to Rs 1,143 crore in Q2 FY27 from Rs 1,652 crore in Q2 FY26.
powered by IRIS
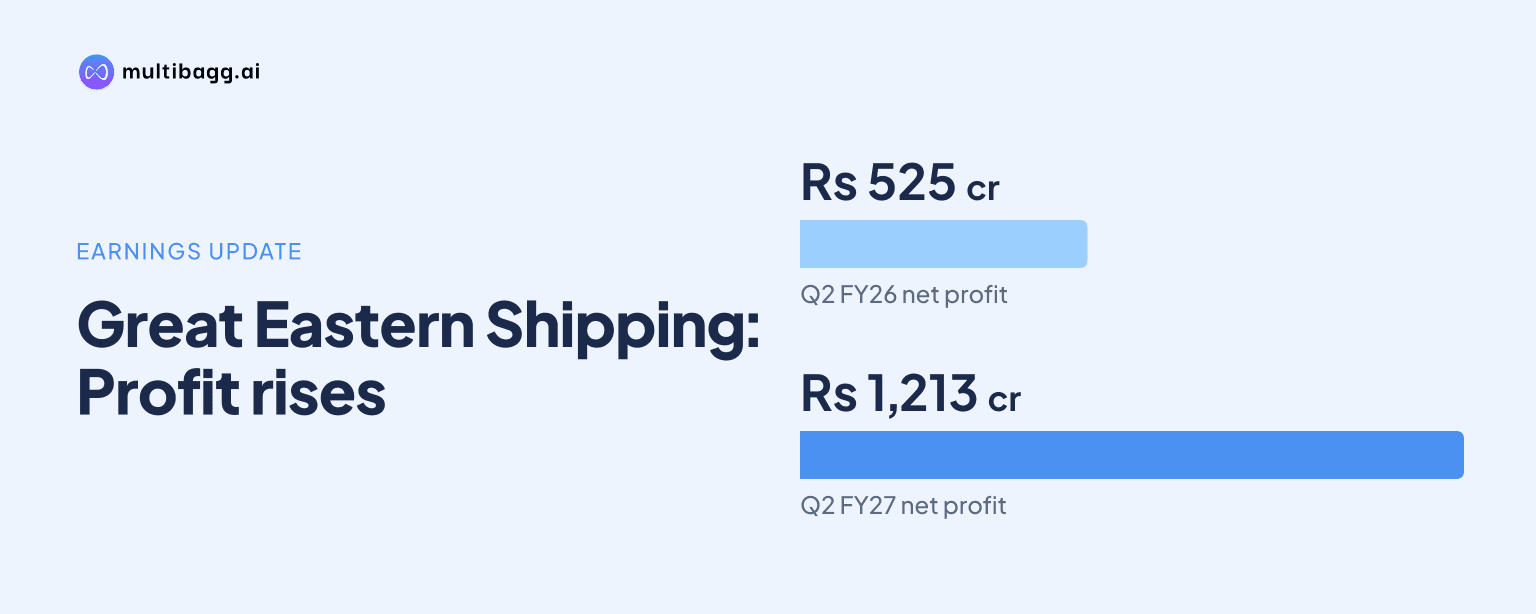
The Great Eastern Shipping Company Limited reported normalised consolidated net profit of Rs 1,213 crore in Q2 FY27, up Rs 688 crore from Rs 525 crore in Q2 FY26, while Rs 308 crore of profit on ship and other asset sales also lifted its reported consolidated result.
Know Great Eastern Shipping Company inside out
Results, valuation, peers and who's buying, in one view.
How much did Great Eastern Shipping’s normalised profit increase?
Great Eastern Shipping’s normalised consolidated net profit increased to Rs 1,213 crore in Q2 FY27 from Rs 525 crore in Q2 FY26, a rise of Rs 688 crore. Normalised consolidated earnings before interest, tax, depreciation and amortisation, or EBITDA, rose to Rs 1,504 crore from Rs 797 crore, while revenue including other income increased to Rs 2,234 crore from Rs 1,382 crore.
The Q2 FY27 result contributed Rs 2,517 crore of normalised consolidated net profit for H1 FY27. Normalised H1 FY27 consolidated EBITDA was Rs 3,111 crore on revenue of Rs 4,520 crore, showing that the first-half earnings total included a second-quarter contribution of Rs 1,213 crore in net profit.
How did Great Eastern Shipping’s normalised earnings differ from reported profit?
Great Eastern Shipping reported consolidated net profit of Rs 1,269 crore in Q2 FY27, compared with normalised net profit of Rs 1,213 crore, a difference of Rs 56 crore. In Q2 FY26, reported consolidated profit was Rs 581 crore and normalised profit was Rs 525 crore, also a Rs 56 crore difference.
Great Eastern Shipping says its normalised financial workings remove the effect of exchange rates on foreign-currency loans, current assets and liabilities, including cash and bank balances. The adjustments also cover tax reversals and impairments taken in FY25, while mark-to-market changes on Indian rupee-foreign currency swaps used with non-convertible debentures, or NCDs, are adjusted to reflect the effective cost of synthetic fixed-rate US dollar loans.
What contribution did ship sales make in Q2 FY27?
Great Eastern Shipping recorded Rs 308 crore of consolidated profit on the sale of ships and other assets in Q2 FY27, against no such profit in Q2 FY26. This amount was included in total other income of Rs 421 crore for the quarter, alongside Rs 113 crore of other income.
The industry-format profit and loss statement shows consolidated time charter equivalent, or TCE, of Rs 1,598 crore in Q2 FY27, up from Rs 1,063 crore a year earlier. TCE represents operating revenue after direct operating or voyage expenses: consolidated operating revenue rose to Rs 1,816 crore from Rs 1,236 crore, while direct operating and voyage expense increased to Rs 219 crore from Rs 174 crore.
Great Eastern Shipping’s consolidated total expense was Rs 511 crore in Q2 FY27, compared with Rs 413 crore in Q2 FY26. After Rs 253 crore of depreciation and amortisation, Rs 18 crore of finance expense, Rs 7 crore of derivative losses, a Rs 66 crore foreign-currency exchange gain and Rs 27 crore of tax expense, reported consolidated profit was Rs 1,269 crore.
Got a follow-up? Ask IRIS
Which operating and market measures changed year-on-year?
Great Eastern Shipping’s normalised consolidated return on equity was 26% in Q2 FY27, compared with 14% in Q2 FY26, and return on capital employed was 25%, compared with 13%. Normalised earnings per share rose to Rs 85.18 from Rs 36.79, while cash profit per share increased to Rs 102.91 from Rs 52.46.
In tanker markets, the presentation says average Suezmax earnings reached US$180,689 per day in H1 FY27, versus US$46,509 per day in H1 FY26, a 289% increase. Average medium-range, or MR, tanker earnings rose 64% to US$31,550 per day, while crude tanker fleet growth was about 2% year-on-year and product tanker fleet growth was about 6%.
Dry-bulk market data also showed higher benchmark earnings in H1 FY27. Average Baltic Capesize 5T/C earnings were US$38,927 per day, up 80% from US$21,674 per day in H1 FY26, and average Baltic Supra BSI-58 10T/C earnings increased 45% to US$18,277 per day.
What does Great Eastern Shipping’s balance sheet show?
Great Eastern Shipping’s normalised consolidated gross debt was Rs 1,143 crore at Q2 FY27, down from Rs 1,652 crore at Q2 FY26. It reported negative net debt of Rs 8,131 crore in both Q2 FY27 and H1 FY27, compared with negative net debt of Rs 6,502 crore in Q2 FY26.
On a reported basis, consolidated total assets were Rs 21,171 crore at Q2 FY27, up from Rs 17,743 crore a year earlier, while equity increased to Rs 18,932 crore from Rs 15,225 crore. Reported operating cash flow rose to Rs 1,267 crore from Rs 658 crore, and net cash inflow was Rs 436 crore after an outflow of Rs 282 crore in Q2 FY26.
Great Eastern Shipping reported consolidated net asset value, or NAV, of Rs 2,224 per share as its highest-ever level in Q2 FY27. Its normalised consolidated NAV range was Rs 2,197 to Rs 2,250 per share, compared with Rs 1,461 to Rs 1,508 per share in Q2 FY26, while the interim dividend was maintained at Rs 14.40 per share for the 19th consecutive quarter.
Conclusion
Great Eastern Shipping’s Q2 FY27 earnings improvement reflected higher normalised consolidated profit of Rs 1,213 crore, rising TCE of Rs 1,598 crore and a Rs 308 crore gain from selling ships and other assets. The reported profit of Rs 1,269 crore was Rs 56 crore above the normalised figure, illustrating the impact of the presentation’s currency, swap and related adjustments.
Next, investors can watch whether the tanker-market conditions cited by Great Eastern Shipping persist, particularly crude trade and Hormuz transit efficiency amid the stated risk from escalating Iranian attacks. The presentation also identifies a 28% crude-tanker order book, a 22% product-tanker order book and a roughly 16% dry-bulk orderbook-to-fleet ratio as disclosed supply factors relevant to future market conditions.