










Great Eastern Shipping sees Suezmax earnings rise 289% in H1
Key highlights
- Great Eastern Shipping reported H1 FY27 Suezmax earnings of USD 180,689 per day, up 289% from USD 46,509 per day.
- Global crude trade recovered 8% quarter on quarter in Q2 FY27, while AG loadings reached about 8 mbpd.
- The crude-tanker fleet grew about 2% year on year, but Hormuz delays and rerouted cargoes kept capacity stretched.
- Suezmax tanker prices rose 50-55% quarter on quarter, while crude-tanker orders equalled 28% of the fleet.
powered by IRIS
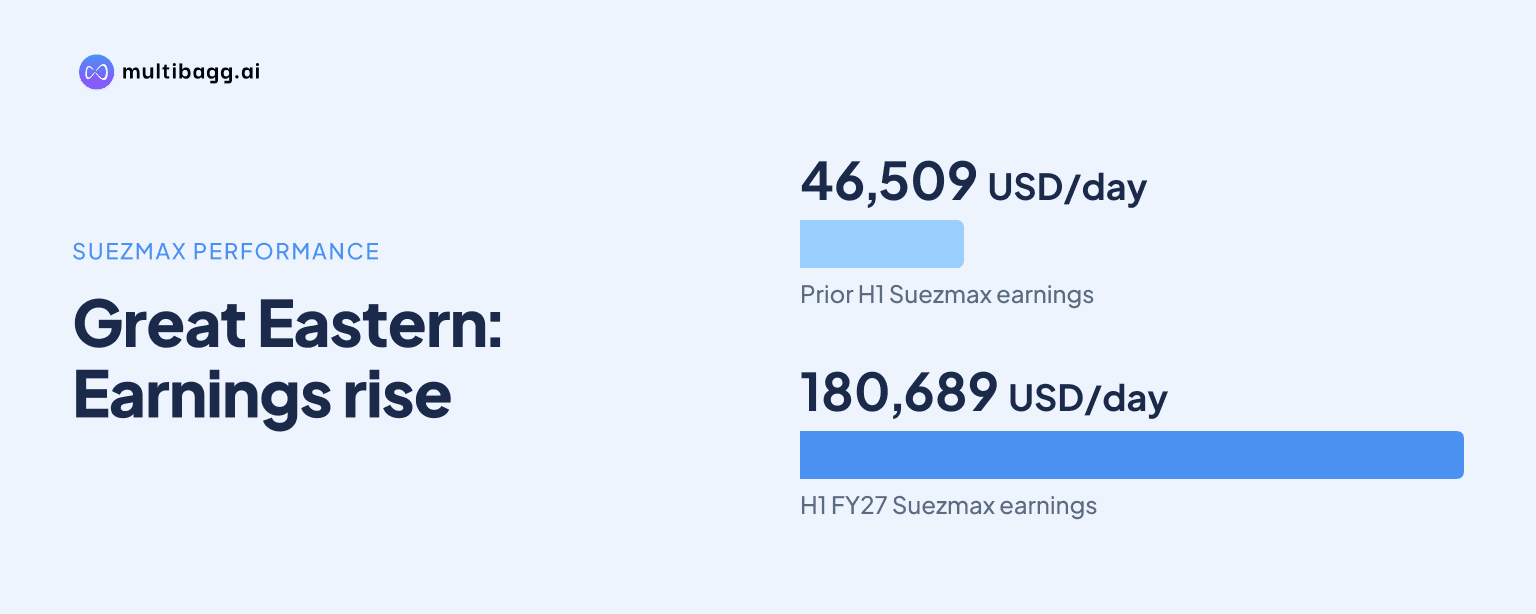
The Great Eastern Shipping Co. Ltd. reported average Suezmax earnings of USD 180,689 per day in H1 FY27, up 289% from USD 46,509 in H1 FY26, as inefficient Hormuz transits, Arabian Gulf ship-to-ship operations and rerouted West-to-East cargoes kept crude-tanker capacity occupied for longer despite 2% year-on-year fleet growth.
Know Great Eastern Shipping Company inside out
Results, valuation, peers and who's buying, in one view.
Why did Great Eastern Shipping's Suezmax earnings rise in H1 FY27?
Great Eastern Shipping's Suezmax earnings rose because disrupted crude-trade routes increased the time required to deploy vessels, lifting the H1 FY27 average to USD 180,689 per day from USD 46,509 per day a year earlier. The presentation cited inefficient transits through Hormuz and ship-to-ship, or STS, operations in the Arabian Gulf, or AG, as constraints on effective vessel availability.
The increase occurred while the total crude-tanker fleet grew by about 2% year on year. Great Eastern Shipping said higher West-to-East flows and rerouting of cargoes after the Yanbu disruption kept the fleet stretched, indicating that longer voyages and operating delays offset part of the additional physical vessel supply.
The Suezmax increase was substantially larger than the movement in the medium-range, or MR, product-tanker benchmark. MR earnings averaged USD 31,550 per day in H1 FY27, up 64% from USD 19,236 in H1 FY26, compared with the 289% Suezmax increase linked to crude-route disruption and longer-distance flows.
Great Eastern Shipping presented the earnings figures as industry-report data. The USD 134,180-per-day difference between the H1 FY27 and H1 FY26 Suezmax averages shows the scale of the rate change during a period when route inefficiency, rather than a contraction in the reported crude fleet, affected available tanker capacity.
How did crude trade flows change in Q2 FY27?
Global crude trade recovered 8% quarter on quarter in Q2 FY27, while AG loadings rose to about 8 million barrels per day, or mbpd, and about 60% of pre-war levels. Great Eastern Shipping said AG loadings remained on an upward trend, but identified escalating Iranian attacks as a risk to the sustainability of the recovery.
China's seaborne crude imports improved sequentially to about 7.4 mbpd in Q2 FY27, although they remained about 3-4 mbpd below pre-war levels. This means that import activity recovered from earlier levels but had not returned to the trade volumes stated in the presentation's pre-war comparison.
Loadings west of Suez remained elevated in Q2 FY27, and rerouted Yanbu cargoes supported ton-miles, which combine cargo volume and distance travelled. Great Eastern Shipping's data therefore points to longer vessel deployment requirements even though China imports and AG loadings were still below the cited pre-war reference points.
Got a follow-up? Ask IRIS
How did product tanker conditions compare with crude tankers?
Product-tanker conditions also improved in Q2 FY27, but MR earnings increased less sharply than Suezmax earnings, rising 64% year on year to USD 31,550 per day in H1 FY27. Great Eastern Shipping attributed the product-market improvement to a 9% quarter-on-quarter recovery in global product trade, supported by exports from Asia and the Middle East.
AG clean petroleum product exports recovered to about 40% of pre-war levels in Q2 FY27, while diesel remained tight because Russian exports were minimal. The presentation also said Asian exports to western markets rebounded during the quarter, as strong diesel cracks in the West supported flows from Asia.
Supply conditions differed across tanker segments. The total product-tanker fleet grew by about 6% year on year, compared with 2% for the crude-tanker fleet, but the long-range 2, or LR2, fleet contracted by 30% year on year as vessels switched to dirty trades carrying crude and other unrefined petroleum cargoes.
The 30% LR2 contraction shows how fleet switching reduced availability in one product-tanker class despite the 6% increase in the overall product fleet. In crude shipping, Great Eastern Shipping instead identified Hormuz delays, AG STS activity, higher West-to-East flows and Yanbu rerouting as the mechanisms stretching capacity.
What do tanker asset prices and order books show?
Suezmax tanker prices rose by 50-55% quarter on quarter in Q2 FY27, exceeding the 10-25% increase reported for Aframax and product tankers. The larger Suezmax asset-price movement coincided with average Suezmax earnings of USD 180,689 per day in H1 FY27 and a crude fleet that grew about 2% year on year.
Great Eastern Shipping reported crude-tanker and product-tanker order books equal to 28% and 22%, respectively, of their existing fleets. An order book measures vessels on order relative to the current fleet, but the presentation does not provide delivery dates or identify how much of either order book will enter service in a specific financial year.
The order-book figures are a separate supply factor from the Q2 FY27 operational disruption. Great Eastern Shipping's disclosed 28% crude-tanker order book sits alongside inefficient Hormuz and AG operations, while the 22% product-tanker order book comes with a 30% year-on-year reduction in the LR2 fleet due to switches into dirty trades.
Conclusion
Great Eastern Shipping's H1 FY27 market data shows that Suezmax economics were driven by vessel time as well as cargo volumes. Average Suezmax earnings increased 289% to USD 180,689 per day despite 2% crude-fleet growth, while MR earnings rose 64% to USD 31,550 per day in a product market where total fleet growth was about 6%.
The next issue to watch is whether AG loadings, at about 8 mbpd and 60% of pre-war levels in Q2 FY27, can continue to recover amid the stated risk of escalating Iranian attacks. Great Eastern Shipping also disclosed crude and product order books equal to 28% and 22% of fleet, respectively, while the duration of Hormuz delays, STS inefficiency and Yanbu rerouting remains unresolved.