










Kanohar EBITDA margin reached 27.6% in FY26 from 9.3%
Key highlights
- Kanohar reported EBITDA of Rs 180.4 crore and an EBITDA margin of 27.6% in FY26.
- Kanohar’s revenue increased to Rs 653.8 crore in FY26 from Rs 303.8 crore in FY23.
- Kanohar’s profit after tax rose to Rs 129.6 crore in FY26, with a 19.8% margin.
- Kanohar reported return on capital employed of 70.1% and gross debt-to-equity of 0.1 times in FY26.
powered by IRIS
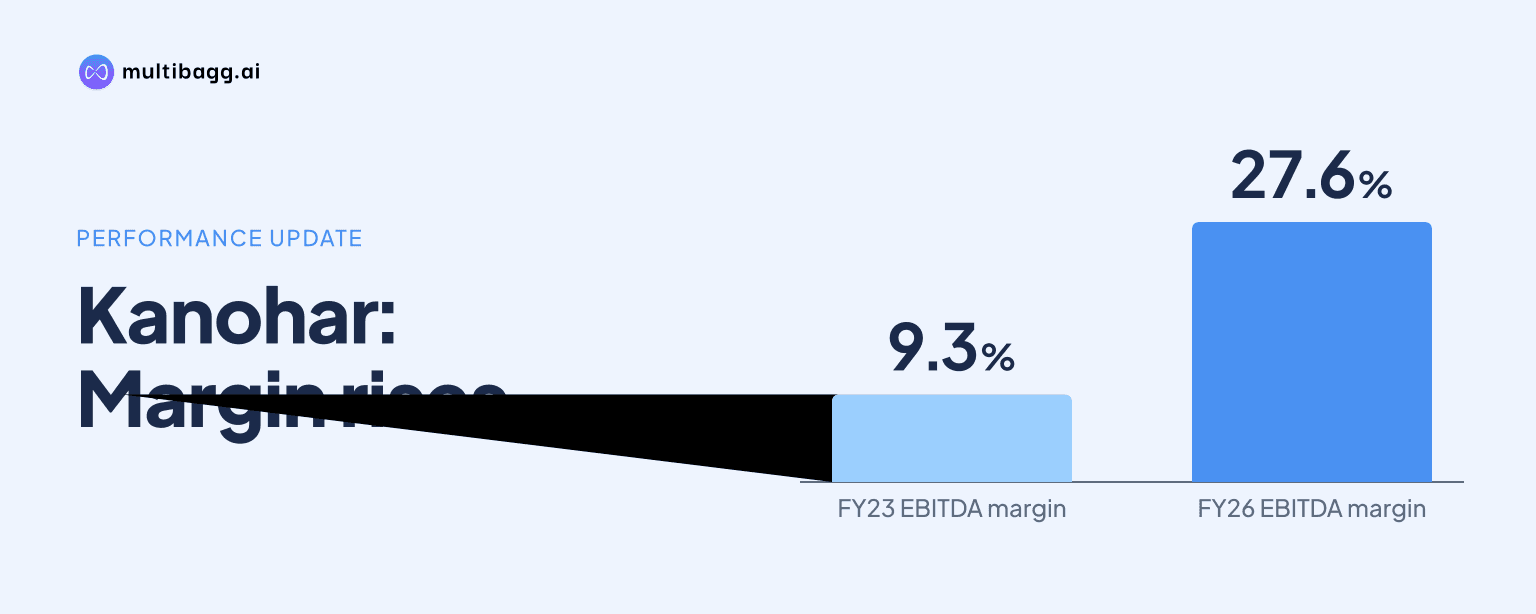
Kanohar Electricals Ltd. lifted its earnings before interest, tax, depreciation and amortisation (EBITDA) margin to 27.6% in FY26 from 9.3% in FY23, while EBITDA rose to Rs 180.4 crore from Rs 28.4 crore. Kanohar attributes the change to higher orders, including special-transformer orders, increased manufacturing and lower engineering, procurement and construction (EPC) activity.
Know Kanohar Electricals inside out
Results, valuation, peers and who's buying, in one view.
How did Kanohar’s revenue and margins change?
Kanohar’s revenue reached Rs 653.8 crore in FY26, up from Rs 303.8 crore in FY23, after first declining to Rs 276.7 crore in FY24. Revenue then rose to Rs 450.6 crore in FY25 and increased by a further Rs 203.2 crore in FY26. The presentation reports a 29% compound annual growth rate across FY23 to FY26.
Kanohar’s gross profit increased from Rs 71.7 crore in FY23 to Rs 254.2 crore in FY26, and gross margin rose in every reported year. Cost of goods sold increased from Rs 232.1 crore to Rs 399.6 crore over the same period, a smaller absolute increase than the Rs 350.0 crore rise in revenue. The resulting gross-margin expansion preceded the increase in EBITDA margin.
What did Kanohar attribute the margin increase to?
Kanohar attributes its profitability improvement to higher orders and orders in special transformers, which it says created a superior product mix. Management also links the outcome to increased manufacturing, lower EPC activity and operating leverage. EBITDA margin rose by 9.5 percentage points from 11.2% in FY24 to 20.7% in FY25, followed by a 6.9-percentage-point increase in FY26.
Kanohar’s reported cost pattern shows gross profit rising faster than operating costs over FY23 to FY26. Employee cost increased from Rs 19.4 crore to Rs 40.6 crore, while other expenses rose from Rs 23.9 crore to Rs 33.2 crore. Over that same period, gross profit increased by Rs 182.5 crore and EBITDA increased by Rs 152.0 crore, consistent with the presentation’s explanation of operating leverage.
Earnings before interest and tax (EBIT) reached Rs 186.5 crore in FY26, compared with Rs 28.7 crore in FY23, while EBIT margin increased from 9.4% to 28.5%. Depreciation was broadly unchanged at Rs 2.9 crore in FY23 and Rs 3.0 crore in FY26. Finance cost nevertheless rose from Rs 5.0 crore to Rs 12.9 crore, although profit before tax increased to Rs 173.6 crore from Rs 23.7 crore.
Got a follow-up? Ask IRIS
How did Kanohar’s profit and returns change?
Kanohar’s profit after tax rose to Rs 129.6 crore in FY26 from Rs 16.8 crore in FY23, and its profit-after-tax margin increased to 19.8% from 5.5%. Profit after tax was Rs 17.8 crore in FY24 and Rs 65.1 crore in FY25, making the FY26 increase Rs 64.5 crore from the previous year. The presentation reports a 98% compound annual growth rate for profit after tax over FY23 to FY26.
Kanohar’s return on capital employed rose to 70.1% in FY26 from 20.8% in FY23, after declining to 16.7% in FY24 and recovering to 47.6% in FY25. Return on equity followed a similar sequence, moving from 11.1% in FY23 to 10.5% in FY24, 30.9% in FY25 and 42.1% in FY26. Both measures reached their highest level in the four reported years in FY26.
Kanohar reported earnings per share of Rs 17.41 in FY26, compared with Rs 2.26 in FY23. Total equity increased to Rs 372.8 crore at March 2026 from Rs 160.5 crore at March 2023. Other equity accounted for Rs 358.0 crore of the March 2026 balance, compared with Rs 156.5 crore at March 2023.
What happened to Kanohar’s leverage and cash conversion?
Kanohar reported gross debt-to-equity of 0.1 times in FY25 and FY26, compared with 0.2 times in FY23 and FY24. At March 2026, non-current borrowings were Rs 14.4 crore and current borrowings were Rs 24.6 crore. Total equity at that date was Rs 372.8 crore, compared with borrowings of Rs 0.4 crore and Rs 23.2 crore, respectively, at March 2023.
Kanohar’s net working-capital days declined to 107 in FY26 from 113 in FY25 and 124 in FY24, but remained above 64 days in FY23. Changes in working capital used Rs 107.0 crore in FY26, compared with a Rs 3.6 crore source of cash in FY25. Inventories increased to Rs 114.2 crore at March 2026 from Rs 43.4 crore a year earlier, while trade receivables increased to Rs 210.8 crore from Rs 194.8 crore.
Kanohar generated Rs 25.8 crore of net cash from operating activities in FY26, down from Rs 79.4 crore in FY25 but above outflows of Rs 23.1 crore in FY23 and Rs 16.3 crore in FY24. Operating profit before working-capital changes was Rs 177.5 crore in FY26, compared with Rs 93.4 crore in FY25. Direct taxes paid increased to Rs 44.7 crore from Rs 17.7 crore, while net cash used in investing activities declined to Rs 21.9 crore from Rs 61.5 crore.
Conclusion
Kanohar’s FY23-to-FY26 record shows expansion in revenue, gross profit and earnings alongside a stated shift toward special-transformer orders and manufacturing. Revenue rose from Rs 303.8 crore to Rs 653.8 crore, gross margin increased from 23.6% to 38.9%, and EBITDA margin rose from 9.3% to 27.6%. Profit-after-tax margin also increased from 5.5% to 19.8%.
The next financial updates will show whether Kanohar can improve cash conversion while sustaining its reported margin profile. Net working-capital days were 107 in FY26 and working-capital changes used Rs 107.0 crore of cash, despite Rs 177.5 crore of operating profit before those changes. Capital work-in-progress also stood at Rs 14.0 crore at March 2026, compared with Rs 1.3 crore at March 2025.