










LIC H1 FY27 profit rises 21.5% as premium income grows 11.6%
Key highlights
- LIC’s H1 FY27 profit after tax rose 21.52% to Rs 25,568 crore.
- LIC’s total premium income increased 11.64% to Rs 2,74,269 crore in H1 FY27.
- LIC’s premium market share declined to 58.77% from 59.41% in H1 FY26.
- LIC’s overall expense ratio fell to 10.41% from 11.28% in H1 FY26.
powered by IRIS
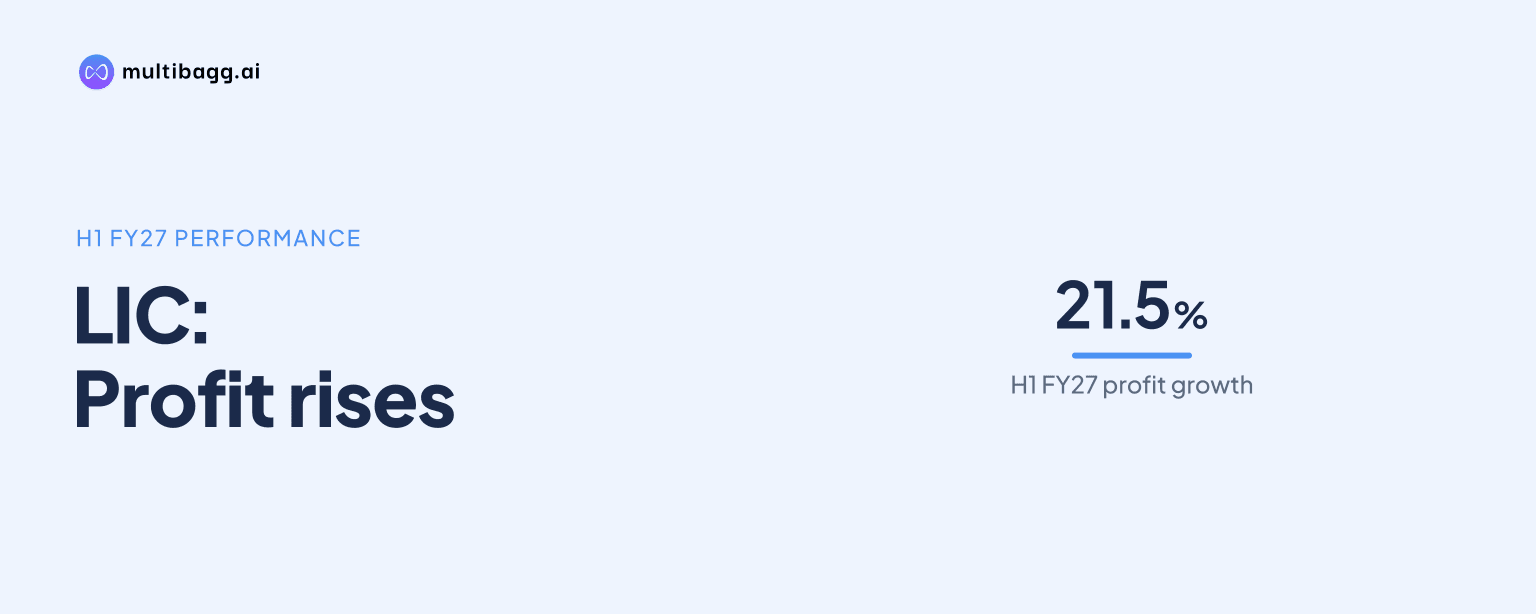
Life Insurance Corporation of India (LIC) reported H1 FY27 profit after tax of Rs 25,568 crore, up 21.52% from H1 FY26, while total premium income increased 11.64% to Rs 2,74,269 crore. Profit growth outpaced premium growth even as LIC’s market shares in premiums and policies declined year on year.
Know Life Insurance Corporation of India inside out
Results, valuation, peers and who's buying, in one view.
How did LIC’s H1 FY27 profit compare with last year?
LIC’s profit after tax rose by Rs 4,528 crore to Rs 25,568 crore in H1 FY27 from Rs 21,040 crore in H1 FY26, a 21.52% increase. Total premium income increased by Rs 28,589 crore to Rs 2,74,269 crore, or 11.64%, meaning reported profit grew faster than premium income during the comparable half-year periods.
The difference between profit and premium growth coincided with a lower overall expense ratio. LIC’s overall expense ratio declined by 0.87 absolute points to 10.41% in H1 FY27 from 11.28% in H1 FY26. The presentation does not separately quantify how much of the profit increase came from expense changes, investment performance or other components.
LIC’s H1 FY27 profit growth also exceeded the 19.25% rise reported for FY26, when profit after tax increased to Rs 57,419 crore from Rs 48,151 crore in FY25. The two periods are not directly comparable because H1 FY27 covers six months, but both reported periods showed profit growth above total premium-income growth of 11.64% in H1 FY27 and 9.80% in FY26.
What drove LIC’s premium income growth in H1 FY27?
LIC’s group business premium was the fastest-growing reported premium line, increasing 19.62% to Rs 1,13,594 crore in H1 FY27 from Rs 94,965 crore a year earlier. Individual new business premium rose 14.86% to Rs 32,725 crore, while individual renewal premium grew 4.68% to Rs 1,27,950 crore from Rs 1,22,224 crore.
Individual weighted received premium, a measure LIC reports for individual business, increased 14.50% to Rs 17,510 crore from Rs 15,293 crore. Total individual new business sum assured increased more slowly, by 5.16% to Rs 2,59,900 crore from Rs 2,47,140 crore. The reported premium measures therefore rose faster than individual new business sum assured in H1 FY27.
H1 FY27 growth rates were higher than the full-year FY26 rates for each of the three reported premium measures. In FY26, total premium income grew 9.80%, individual new business premium rose 8.29%, and group business premium increased 16.26%. This means H1 FY27 recorded faster reported growth in total premiums, group premiums and individual new business premiums than FY26 did against FY25.
Why did LIC’s market share decline despite premium growth?
LIC’s market share in premium declined by 0.64 absolute points to 58.77% in H1 FY27 from 59.41% in H1 FY26, despite the 11.64% rise in its total premium income. The presentation uses Life Insurance Council data for market-share figures and shows that LIC’s share decreased while its own premiums increased.
The decline was larger in policy market share. LIC’s market share in policies fell by 2.61 absolute points to 60.83% from 63.44%, while the number of individual policies sold decreased 2.25% to 70,97,094 from 72,60,573. Policies sold through bancassurance and alternate channels also fell 2.94% to 1,08,789 from 1,12,082.
The H1 movement follows declines reported for FY26. LIC’s premium market share was 56.66% in FY26, down 0.39 absolute points from FY25, while policy market share was 65.16%, down 0.67 absolute points. The presentation does not provide a reason for the H1 FY27 market-share decline or disclose a market-share target.
Got a follow-up? Ask IRIS
What do LIC’s claims, assets and solvency figures show?
LIC reported assets under management of Rs 59,60,941 crore in H1 FY27, up 4.16% from Rs 57,22,896 crore in H1 FY26. Its solvency ratio was 2.35, compared with 2.13 a year earlier, an increase of 0.22 on the reported ratio. LIC reported a solvency ratio of 2.35 for FY26 as well.
Individual death claims numbered 4,08,880 in H1 FY27, down 0.26% from 4,09,966, but the amount paid increased 5.33% to Rs 12,691 crore from Rs 12,049 crore. The death-claim settlement ratio declined by 0.51 absolute points to 96.74% from 97.25%. LIC notes that this ratio includes unclaimed amounts from the previous 10 years brought back to outstanding under Insurance Regulatory and Development Authority of India regulations.
Maturity claims showed a different pattern in H1 FY27. Their number declined 14.55% to 78,90,878 from 92,34,314, while the maturity-claim amount paid increased 16.93% to Rs 1,25,806 crore from Rs 1,07,587 crore. The reported value of maturity payouts therefore rose despite a lower number of maturity claims.
How did LIC’s investment yields and retention metrics change?
LIC’s policyholders’ fund yield on investment declined by 0.23 absolute points to 8.67% in H1 FY27 from 8.90% in H1 FY26. By contrast, yield on the shareholders’ fund, excluding unrealised gains, rose by 0.06 absolute points to 6.54% from 6.48%. LIC reports the two funds separately, so the movements are distinct measures.
LIC’s total gross non-performing asset ratio for the policyholders’ fund declined by 0.18 absolute points to 1.16% from 1.34%. The conservation ratio, which LIC reports as a retention measure, decreased by 0.95 absolute points to 90.20% from 91.15%. Individual renewal premium nevertheless rose 4.68% to Rs 1,27,950 crore in H1 FY27.
The reported expense ratio decreased to 10.41% from 11.28%, while the policyholders’ fund investment yield declined to 8.67% from 8.90%. These changes occurred alongside the 21.52% increase in profit after tax, although the presentation does not attribute the profit movement to individual ratio changes.
Conclusion
LIC’s H1 FY27 results combined a 21.52% increase in profit after tax with 11.64% premium growth and a 0.87 absolute-point reduction in the expense ratio. Group business premium rose 19.62% and individual new business premium increased 14.86%, while individual policy sales, premium market share and policy market share declined from H1 FY26.
The main unresolved matters in the presentation are the reasons for the declines in premium share to 58.77%, policy share to 60.83% and conservation ratio to 90.20%. LIC does not disclose a market-share target, operating plan or scheduled event for these measures, so subsequent reported periods will show whether the H1 FY27 movements persist.