










M&M Automotive Revenue Rises 39% as PBIT Margin Falls 50 bps
Key highlights
- M&M automotive consolidated revenue rose 39% year-on-year to Rs 37,756 crore in Q2 F27.
- M&M sold 3,30,896 vehicles in Q2 F27, up 26% from 2,61,703 units.
- M&M automotive consolidated PBIT margin was 8.8%, down 50 basis points year-on-year but up 110 basis points sequentially.
- M&M automotive consolidated PAT increased 55% year-on-year to Rs 2,388 crore in Q2 F27.
powered by IRIS
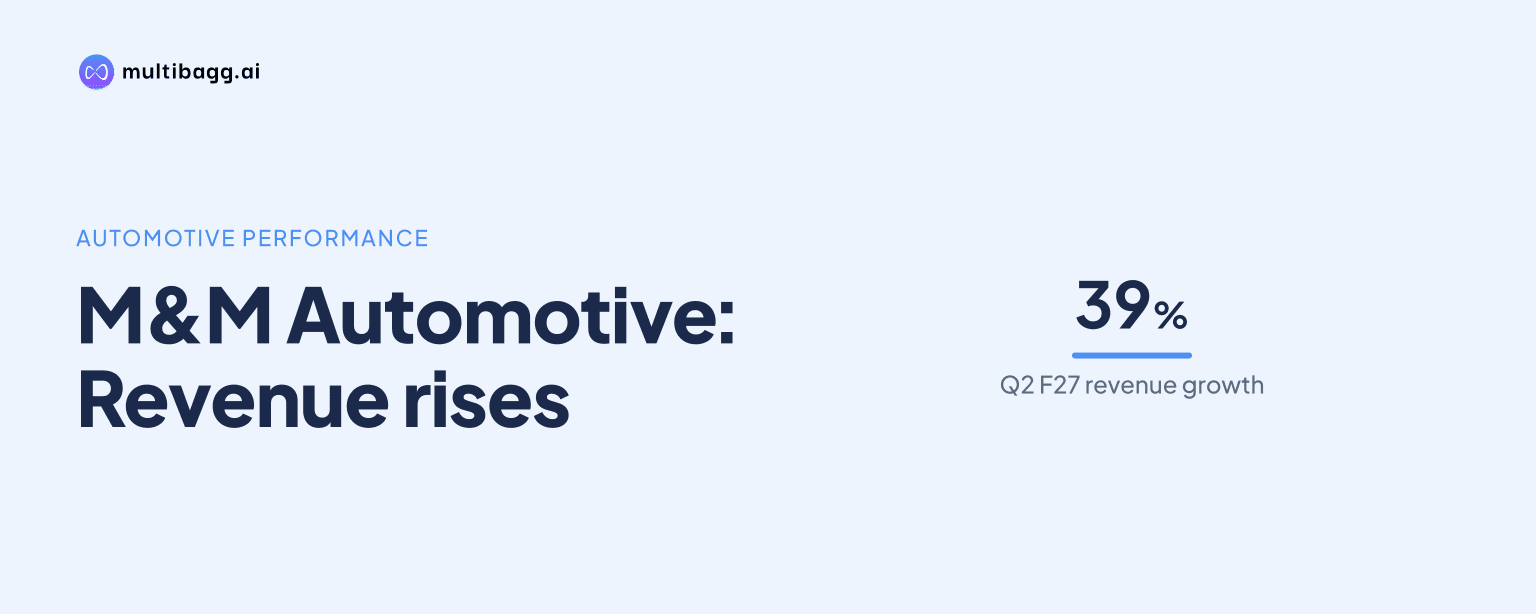
Mahindra & Mahindra Limited reported consolidated automotive revenue of Rs 37,756 crore in Q2 F27, up 39% year-on-year, while consolidated profit before interest and tax (PBIT) margin fell 50 basis points to 8.8% from 9.3%. Total vehicle sales increased 26% to 3,30,896 units during the quarter.
Know Mahindra & Mahindra inside out
Results, valuation, peers and who's buying, in one view.
How did M&M’s automotive business perform in Q2 F27?
M&M’s automotive business increased consolidated revenue to Rs 37,756 crore in Q2 F27 from Rs 27,171 crore in Q2 F26, while consolidated profit after tax (PAT) rose 55% year-on-year to Rs 2,388 crore. The revenue increase was larger than the 26% growth in total vehicle sales to 3,30,896 units.
Consolidated automotive PBIT reached Rs 3,319 crore in Q2 F27, compared with Rs 2,538 crore a year earlier. PBIT therefore increased in absolute terms by 31%, but its growth trailed the 39% rise in segment revenue, resulting in a lower PBIT margin than in Q2 F26.
M&M reported SUV volumes of 1,83,000 units in Q2 F27 and an SUV revenue market share of 24.3%. Rajesh Jejurikar, Executive Director and CEO of the Auto and Farm Sector, said SUV volume grew 26% year-on-year and that M&M retained leadership in SUV revenue market share.
Why was M&M’s automotive PBIT margin lower than last year?
M&M’s consolidated automotive PBIT margin was lower because it stood at 8.8% in Q2 F27 versus 9.3% in Q2 F26, despite PBIT rising to Rs 3,319 crore from Rs 2,538 crore. The release does not allocate the year-on-year margin movement among commodity costs, product mix, pricing or other individual factors.
On a standalone basis, automotive revenue rose 36% to Rs 33,937 crore in Q2 F27 from Rs 24,929 crore, while PBIT increased 15% to Rs 2,614 crore from Rs 2,281 crore. Standalone PBIT margin consequently fell to 7.7% from 9.2%, a decline of 150 basis points.
M&M also reported standalone automotive PBIT margin of 9.1% excluding eSUV CMA in Q2 F27. The company said this was down 120 basis points year-on-year but up 80 basis points quarter-on-quarter; however, the release does not define CMA or quantify its effect on reported automotive profitability.
Jejurikar cited a significant hike in commodity prices in discussing Farm’s sequential margin outcome, while Group Chief Financial Officer Amarjyoti Barua referred to commodity and geopolitical headwinds. Neither statement quantified the impact of these factors on Auto’s Q2 F27 PBIT margin.
Got a follow-up? Ask IRIS
How did M&M’s automotive margin change from Q1 F27?
M&M’s consolidated automotive PBIT margin improved sequentially to 8.8% in Q2 F27 from 7.7% in Q1 F27, an increase of 110 basis points. Consolidated automotive revenue rose to Rs 37,756 crore from Rs 34,387 crore over the same period, and PBIT increased to Rs 3,319 crore from Rs 2,645 crore.
The sequential improvement did not restore the margin to the 9.3% reported in Q2 F26. M&M’s Q2 F27 result thus showed a 110-basis-point improvement from Q1 F27 but remained 50 basis points below the comparable prior-year quarter.
Standalone automotive PBIT margin also improved sequentially, reaching 7.7% in Q2 F27 from 7.1% in Q1 F27, while standalone revenue rose to Rs 33,937 crore from Rs 31,033 crore. M&M separately reports standalone and consolidated automotive results, so the two bases measure different reporting scopes.
What drove M&M’s vehicle volumes and market position?
M&M sold 3,30,896 vehicles in Q2 F27, up from 2,61,703 units in Q2 F26. The total included 53,103 units sold by LMM, compared with 38,995 units a year earlier, and 22,864 battery electric vehicles sold by MEAL, compared with 12,404 units in Q2 F26.
For H1 F27, M&M reported total vehicle sales of 6,35,317 units, compared with 5,08,952 units in H1 F26. Q2 F27 volume exceeded Q1 F27 sales of 3,04,421 units by 26,475 units, consistent with the quarter-on-quarter increase in automotive revenue and PBIT.
M&M reported a 52.3% market share in light commercial vehicles below 3.5 tonnes and a 36.2% market share in electric three-wheelers in Q2 F27. Its LCV measure includes the Bolero Max Pickup 2T variant classified under LCV 2-3.5 tonnes and Jeeto sales by LMM.
M&M also reported eSUV revenue market share of 30.1% for H1 F27. Jejurikar said the electric-vehicle product range maintained the number-one position in revenue market share during the first half, while the release does not provide a comparable all-market eSUV unit-share figure.
Conclusion
M&M’s Q2 F27 automotive results combined higher scale with a lower year-on-year consolidated PBIT margin. Revenue rose 39% to Rs 37,756 crore, vehicle sales increased 26% to 3,30,896 units and PAT grew 55% to Rs 2,388 crore, but the 8.8% consolidated PBIT margin remained below Q2 F26’s 9.3%.
The next issue to watch is whether the sequential margin improvement continues after consolidated automotive PBIT margin rose 110 basis points from Q1 F27. M&M disclosed that the standalone margin excluding eSUV CMA was 9.1% in Q2 F27 and up 80 basis points sequentially, but it did not provide an automotive margin target or quantify the eSUV CMA effect.