










Mahindra auto PAT rises 55% as BEV profitability improves
Key highlights
- Mahindra auto consolidated PAT rose 55% year on year to Rs 2,388 crore in Q2 F27.
- Mahindra’s SUV and LCV PBIT margin declined to 9.8% from 11.0% in Q2 F26.
- Mahindra’s BEV PBIT margin increased to 9.1% from 7.7% a year earlier.
- Mahindra targets 82,000 units of total monthly auto capacity by the F27 H2 exit.
powered by IRIS
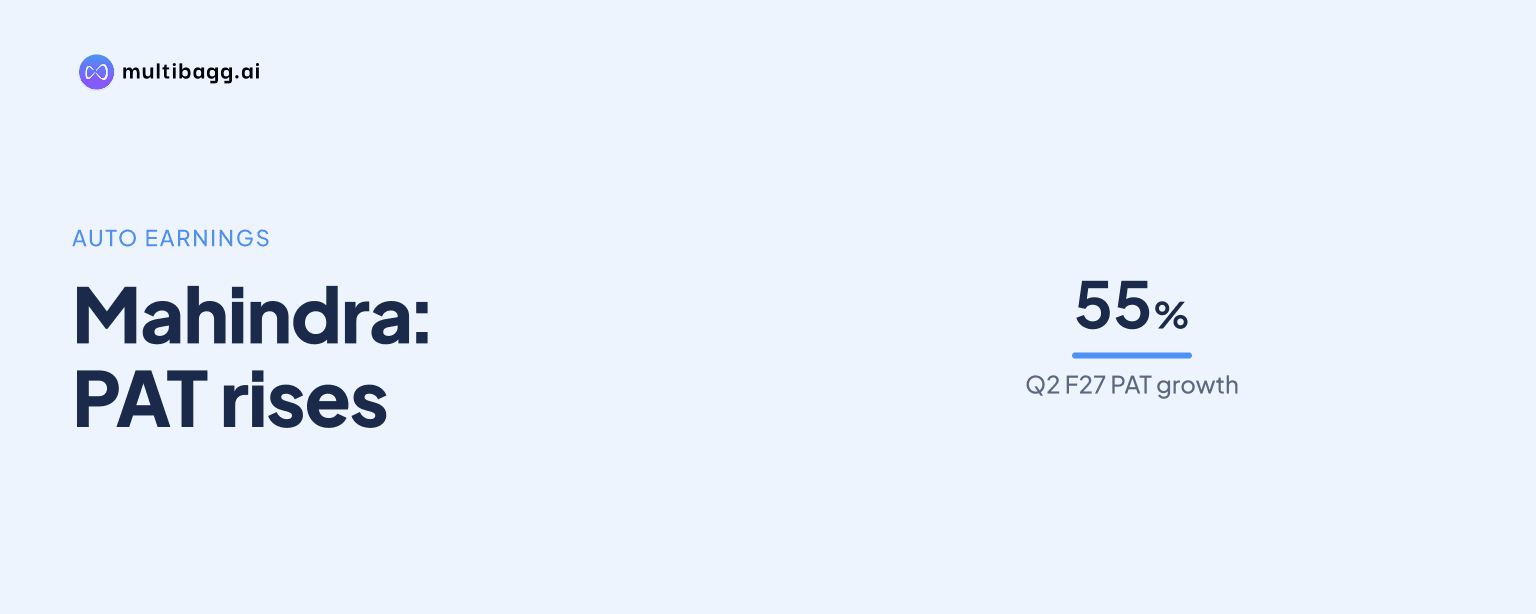
Mahindra’s auto consolidated profit after tax (PAT) rose 55% year on year to Rs 2,388 crore in Q2 F27, while its SUV and light commercial vehicle (LCV) margin declined to 9.8% from 11.0%. Revenue growth and a 9.1% battery-electric vehicle (BEV) profit before interest and tax (PBIT) margin supported the consolidated outcome despite commodity inflation.
Know Mahindra & Mahindra inside out
Results, valuation, peers and who's buying, in one view.
Why did Mahindra’s auto PAT rise 55% in Q2 F27?
Mahindra’s auto PAT rose because consolidated revenue increased 39% to Rs 37,756 crore and PBIT increased 31% to Rs 3,319 crore in Q2 F27. PAT reached Rs 2,388 crore, compared with Rs 1,536 crore in Q2 F26. The presentation states that these consolidated financial figures were net of intercompany eliminations, stock reserve and the share of profit from joint ventures and associates.
The revenue increase exceeded the change in consolidated margin. Auto consolidated PBIT margin was 8.8% in Q2 F27, compared with 9.3% a year earlier, a decline of 50 basis points, with one basis point equal to one-hundredth of a percentage point. However, the margin was 110 basis points above the 7.7% reported in Q1 F27, while PBIT rose from Rs 2,645 crore in the preceding quarter to Rs 3,319 crore.
Mahindra’s reported 55% PAT increase was larger than the 31% increase in PBIT and the 39% revenue increase. The presentation does not provide a separate reconciliation between PBIT and PAT, but identifies the reporting basis for all three figures, including intercompany eliminations, stock reserve and profit shares from joint ventures and associates.
How did Mahindra’s SUV and LCV margins change?
Mahindra’s SUV and LCV PBIT margin declined to 9.8% in Q2 F27 from 11.0% in Q2 F26, despite revenue increasing to Rs 26,881 crore from Rs 20,909 crore. The 120-basis-point year-on-year contraction occurred alongside what the presentation described as steep commodity inflation. The SUV and LCV segment includes exports.
The core SUV and LCV business nevertheless improved sequentially. Its PBIT rose to Rs 2,621 crore in Q2 F27 from Rs 2,243 crore in Q1 F27, and its margin increased to 9.8% from 8.9%. That was a 90-basis-point quarter-on-quarter improvement, although the Q2 F27 margin remained below the 11.0% recorded a year earlier.
The comparison shows a difference between scale and margin in the core business. SUV and LCV revenue was Rs 5,972 crore higher year on year, while PBIT was Rs 315 crore higher. The presentation says the 9.8% margin was achieved despite commodity inflation, but does not quantify the commodity-cost impact or specify pricing, mix or cost actions within the segment.
Got a follow-up? Ask IRIS
Which businesses supported Mahindra’s consolidated auto margin?
Mahindra’s BEV business supported consolidated profitability by lifting its PBIT margin to 9.1% in Q2 F27 from 7.7% in Q2 F26. BEV revenue rose to Rs 6,831 crore from Rs 3,599 crore, while PBIT increased to Rs 624 crore from Rs 279 crore. The BEV reporting scope includes a contract-manufacturing arrangement for electric SUVs.
The improvement in BEV profitability contrasted with the SUV and LCV margin decline. BEV margin increased by 140 basis points year on year, while the core SUV and LCV margin decreased by 120 basis points. This mix helps explain why auto consolidated margin declined by 50 basis points rather than by the full decline in the larger core vehicle business.
Mahindra’s Others business also moved into profit at the PBIT level, reporting Rs 75 crore in Q2 F27 against a Rs 47 crore loss in Q2 F26. This category includes trucks and buses, manufacturing arrangements for two-wheelers and electric three-wheelers, and domestic and international subsidiaries including Last Mile Mobility. Its margin was 1.4%, compared with negative 1.2% a year earlier.
What is Mahindra planning for auto capacity after Q2 F27?
Mahindra is targeting total monthly operational auto capacity of 82,000 units by the F27 H2 exit, compared with 68,000 units at the F27 H1 exit. H1 means the first half of the fiscal year and H2 means the second half. Mahindra said its H1 target was completed and its F27 H2 capacity plan was on track, including 14,000 units a month intended for new launches in F28.
SUV internal-combustion-engine capacity is targeted to rise from 60,000 units per month at the F27 H1 exit to 70,000 by the F27 H2 exit, with 10,000 units allocated for F28 launches. BEV operational capacity was 8,000 units per month at the F27 H1 exit and is targeted at 12,000 by F27 H2, including 4,000 units for F28 launches.
Mahindra also disclosed planned additional NU_IQ capacity of 10,000 units per month in Chakan, taking operational capacity to 92,000 units per month by the F28 exit. A greenfield Nagpur plant has been announced for F29 and beyond, with about 20,000 units per month of operational capacity expected by the H1 F30 exit and another about 20,000 units by H1 F31. Management’s disclosed plan is to double capacity over five years from the F26 exit to the F31 exit.
Conclusion
Mahindra’s Q2 F27 figures show that revenue growth, improved BEV profitability and a shift in Others from a PBIT loss to a profit offset part of the pressure from the lower SUV and LCV margin. Consolidated PBIT margin declined to 8.8% from 9.3% year on year, but improved from 7.7% in Q1 F27, while PAT increased to Rs 2,388 crore.
The next disclosed operating milestones are the F27 H2 capacity targets of 70,000 monthly SUV internal-combustion-engine units, 12,000 monthly BEV units and 82,000 total monthly units. Mahindra’s planned Chakan NU_IQ expansion for the F28 exit and the Nagpur capacity schedule beginning at the H1 F30 exit are the subsequent capacity targets set out in the presentation.