










M&M services PBIT rises 27%, margin falls 300 basis points
Key highlights
- M&M services PBIT rose 27% year on year to Rs 1,998 crore in Q2 F27.
- M&M services PBIT margin fell to 16.9% in Q2 F27 from 19.9% in Q1 F27.
- M&M’s share of services PAT increased 18% to Rs 1,147 crore in Q2 F27.
- M&M services revenue increased 18% year on year to Rs 11,821 crore in Q2 F27.
powered by IRIS
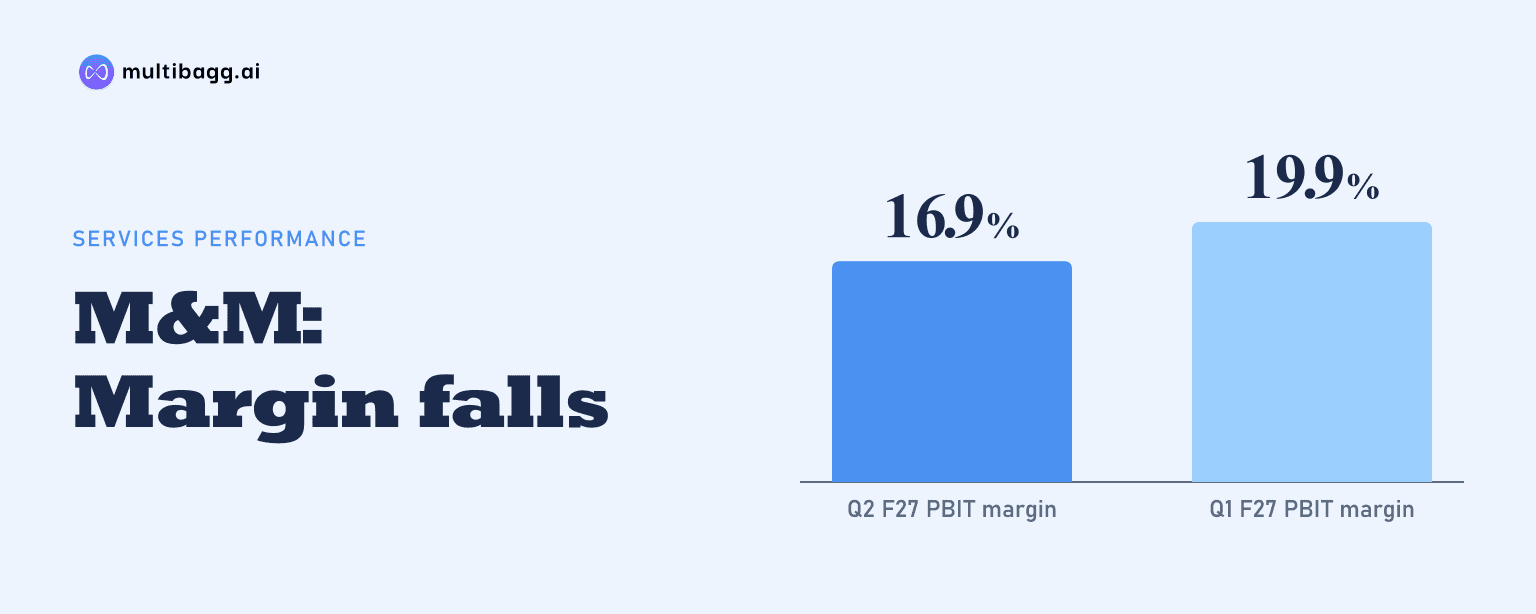
Mahindra & Mahindra Limited reported services profit before interest and tax (PBIT) of Rs 1,998 crore in Q2 F27, 27% above Q2 F26, while M&M’s PBIT margin fell 300 basis points from the preceding quarter to 16.9%. Services revenue rose 18% year on year to Rs 11,821 crore, although it declined sequentially.
Know Mahindra & Mahindra inside out
Results, valuation, peers and who's buying, in one view.
How did M&M services perform in Q2 F27?
M&M services revenue rose 18% year on year to Rs 11,821 crore in Q2 F27, while PBIT increased 27% to Rs 1,998 crore. Revenue was Rs 10,048 crore and PBIT was Rs 1,571 crore in Q2 F26. The results release also reported M&M’s share of services profit after tax (PAT) at Rs 1,147 crore, up 18% year on year.
The quarterly advance did not continue from Q1 F27. Services revenue declined by Rs 1,078 crore from Rs 12,899 crore in Q1 F27, while PBIT fell by Rs 572 crore from Rs 2,570 crore. The factsheet defines services as the financial services segment, industrial businesses and consumer services, and states that PBIT includes the net share of profit or loss of associates and joint ventures.
For H1 F27, M&M services reported revenue of Rs 24,719 crore and PBIT of Rs 4,567 crore, producing an 18.5% PBIT margin. That compares with Rs 19,922 crore of revenue, Rs 2,943 crore of PBIT and a 14.8% margin in H1 F26. Thus, the first-half margin increased 370 basis points year on year despite the lower Q2 F27 margin.
Why did M&M services margin fall from Q1 F27?
M&M services PBIT margin fell to 16.9% in Q2 F27 from 19.9% in Q1 F27, a 300-basis-point decline. One basis point is one-hundredth of a percentage point. The reduction occurred as quarterly revenue decreased from Rs 12,899 crore to Rs 11,821 crore and PBIT declined from Rs 2,570 crore to Rs 1,998 crore.
The release does not give an operational explanation for the sequential margin movement. It identifies individual services-related businesses and provides selected Q2 F27 operating measures, but it does not disclose Q1 F27 revenue, PBIT or margin for Mahindra Finance, Tech Mahindra, Mahindra Lifespaces, Mahindra Holidays or Mahindra Logistics. The disclosed data therefore do not assign the decline to a particular business, cost item or product.
The year-on-year comparison differs from the sequential outcome. Q2 F27’s 16.9% services PBIT margin was 130 basis points above the 15.6% recorded in Q2 F26, as PBIT increased by Rs 427 crore on revenue growth of Rs 1,773 crore. M&M’s share of services PAT rose 18% to Rs 1,147 crore, whereas segment PBIT increased 27%; the release provides no reconciliation between those measures.
Got a follow-up? Ask IRIS
How did M&M services compare with automotive and farm equipment?
M&M services generated Rs 11,821 crore in Q2 F27 revenue, below automotive’s Rs 37,756 crore but above farm equipment’s Rs 9,572 crore. Services PBIT of Rs 1,998 crore was also below automotive’s Rs 3,319 crore and above farm equipment’s Rs 1,376 crore during the quarter.
Services reported the highest PBIT margin of the three businesses at 16.9%, compared with 14.4% for farm equipment and 8.8% for automotive. However, services was the only one of the three to record a sequential margin decline: automotive rose from 7.7% in Q1 F27 and farm equipment rose from 14.2%, while services fell from 19.9%.
At the group level, M&M reported consolidated revenue of Rs 57,553 crore and PAT after non-controlling interest of Rs 4,588 crore in Q2 F27, both 25% higher than Q2 F26. Group PAT margin was 8.0%, unchanged from Q2 F26’s 8.0% but below the 9.4% reported in Q1 F27.
Which businesses did M&M highlight within services?
M&M highlighted Mahindra Finance, Tech Mahindra, Mahindra Lifespaces, Mahindra Holidays and Mahindra Logistics in its Q2 F27 services disclosures. Mahindra Finance reported 15% growth in assets under management (AUM), while gross stage 3 (GS3) was 3.42% and PAT rose 61%. GS3 is the company’s disclosed measure of assets classified in stage 3.
Tech Mahindra reported an earnings before interest and tax (EBIT) margin of 14.8% and 33% growth in PAT in Q2 F27. Mahindra Lifespaces reported residential pre-sales of Rs 1,100 crore, up 41%, and gross development value additions of Rs 1,500 crore. These operating indicators are not presented as a reconciliation to the Rs 11,821 crore services revenue or Rs 1,998 crore services PBIT.
Mahindra Holidays had 5,762 room keys and occupancy of 76%, up 220 basis points in Q2 F27. Mahindra Logistics reported revenue of Rs 2,095 crore, up 24%, and said PAT was positive and three times the previous-year level. M&M did not disclose the absolute PAT of Mahindra Logistics or the individual profit contribution of the named businesses to services PAT of Rs 1,147 crore.
Conclusion
M&M’s services segment delivered higher year-on-year revenue, PBIT and share of PAT in Q2 F27, with PBIT rising Rs 427 crore to Rs 1,998 crore and margin improving 130 basis points from Q2 F26. The quarter also showed a sequential reversal: revenue fell Rs 1,078 crore and the 16.9% margin was 300 basis points below Q1 F27.
The next reported result will show whether services can move back toward the 18.5% PBIT margin recorded for H1 F27 after Q2’s 16.9% level. M&M’s disclosed operating measures to watch include Mahindra Finance’s 15% AUM growth and 3.42% GS3, Tech Mahindra’s 14.8% EBIT margin, and Mahindra Lifespaces’ Rs 1,500 crore of gross development value additions.