










Stove Kraft Limited induction cooktop sales grow 188.9% H1
Key highlights
- Stove Kraft reported 188.9% YoY growth in induction-cooktop sales in H1 FY27.
- Induction cooktops represented 32% of H1 FY27 revenue, while gas cooktops represented 5%.
- Gas-cooktop sales declined 6.6% YoY in H1 FY27.
- Stove Kraft reported H1 FY27 consolidated revenue of Rs 1,065.2 crore, up 30.8% YoY.
powered by IRIS
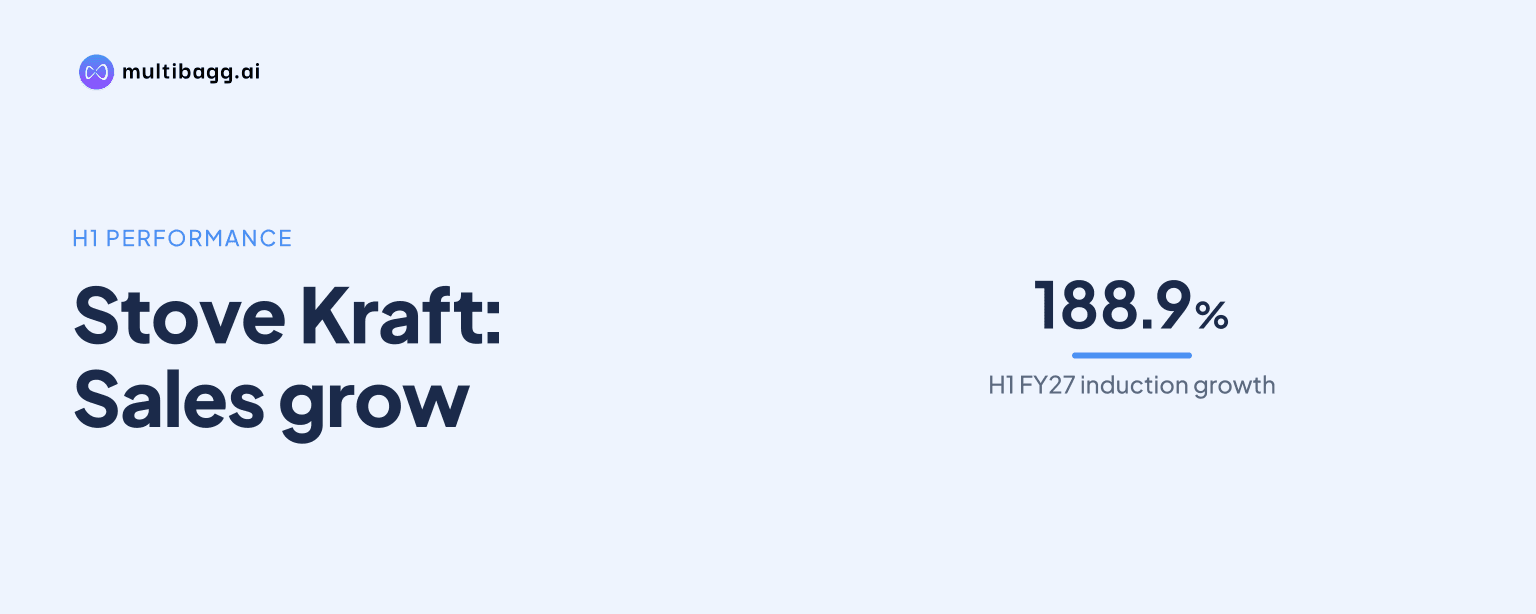
Stove Kraft Limited reported 188.9% year-on-year growth in induction-cooktop sales in H1 FY27, making induction cooktops 32% of consolidated revenue while gas-cooktop sales declined 6.6% and accounted for 5%. The category divergence accompanied consolidated H1 FY27 revenue of Rs 1,065.2 crore, up 30.8% year on year.
Know Stove Kraft inside out
Results, valuation, peers and who's buying, in one view.
Why did Stove Kraft’s induction-cooktop sales grow in H1 FY27?
Stove Kraft did not provide a category-specific explanation for the 188.9% increase, but induction cooktops were its fastest-growing disclosed product category in H1 FY27. Cooker sales rose 44.6% year on year, nonstick cookware rose 9.5%, small appliances rose 4.7%, and gas cooktops declined 6.6%. Year on year, or YoY, compares a period with the corresponding period a year earlier.
The presentation gives percentage growth by category but not absolute revenue for induction or gas cooktops. It therefore shows that induction expanded far faster than the company’s 30.8% consolidated H1 FY27 revenue growth, but it does not quantify the category’s rupee contribution to the overall increase of revenue to Rs 1,065.2 crore.
Q2 FY27 showed the same direction, although at different growth rates. Induction-cooktop sales rose 108.0% YoY in Q2 FY27, while gas-cooktop sales declined 6.4%; cooker sales increased 46.8%, small appliances increased 9.1%, and nonstick cookware declined 1.6%. The H1 and Q2 figures both place induction at the top of the disclosed category-growth ranking.
How did Stove Kraft’s product mix change in H1 FY27?
Stove Kraft’s H1 FY27 mix placed induction cooktops at 32% of revenue, a 27-percentage-point lead over gas cooktops at 5%. Pressure cookers and nonstick cookware each represented 22%, while small appliances represented 18%. The reported category shares total 99% because of rounding.
Induction cooktops were the largest disclosed product category in H1 FY27, ahead of pressure cookers and nonstick cookware by 10 percentage points each. Gas cooktops were the smallest disclosed category at 5%. Stove Kraft did not provide H1 FY26 category shares, so the presentation does not quantify the year-on-year change in each category’s revenue mix.
The Q2 FY27 mix differed from the half-year split. Small appliances accounted for 36% of Q2 revenue, pressure cookers 24%, induction cooktops 18%, nonstick cookware 15%, and gas cooktops 6%. Induction’s H1 share was therefore 14 percentage points above its Q2 share, but the presentation does not disclose Q1 FY27 category shares or explain the difference.
What were Stove Kraft’s H1 FY27 financial results?
Stove Kraft reported consolidated H1 FY27 revenue of Rs 1,065.2 crore, gross profit of Rs 422.1 crore, earnings before interest, tax, depreciation and amortisation, or EBITDA, of Rs 129.1 crore, and profit after tax, or PAT, of Rs 46.0 crore. Revenue grew 30.8% YoY, while gross profit grew 34.8%, EBITDA 39.7%, and PAT 44.8%.
Gross profit, EBITDA and PAT all rose faster than revenue in H1 FY27. However, Stove Kraft did not allocate these measures by product category, meaning the presentation does not establish the profitability of induction cooktops relative to gas cooktops or other product lines.
For Q2 FY27, Stove Kraft reported revenue of Rs 584.7 crore, gross profit of Rs 231.7 crore, EBITDA of Rs 75.3 crore and PAT of Rs 29.0 crore. The respective YoY changes were 23.2%, 26.8%, 32.7% and 35.7%; management described the quarter’s 12.9% EBITDA margin as its highest ever.
Got a follow-up? Ask IRIS
Which Stove Kraft channels and brands expanded in H1 FY27?
Stove Kraft’s largest H1 FY27 channel by disclosed revenue was e-commerce, at Rs 376.1 crore and 35.3% of channel contribution, followed by general trade at Rs 323.7 crore and 30.4%. E-commerce revenue rose 24.2% YoY, while general trade grew 52.2%. The presentation does not link individual product categories, including induction cooktops, to these channels.
Own retail was the fastest-growing disclosed H1 FY27 channel, rising 70.3% YoY to Rs 83.8 crore from Rs 49.2 crore in H1 FY26. Modern retail rose 27.3% to Rs 134.6 crore, corporate sales increased 16.2% to Rs 26.4 crore, and exports declined 1.0% to Rs 120.5 crore. These figures show broader distribution growth but do not identify the channels behind induction-cooktop demand.
Pigeon sales rose to Rs 938.0 crore in H1 FY27 from Rs 686.0 crore in H1 FY26, an increase of Rs 252.0 crore. Original equipment manufacturer, or OEM, sales were Rs 119.6 crore versus Rs 117.1 crore, while Others declined to Rs 7.7 crore from Rs 11.8 crore. Others includes revenue from LED, Gilma, Black & Decker and Skava.
Stove Kraft also reported 360 Pigeon stores across 22 states and 172 Indian cities at the end of Q2 FY27. It added 16 stores during the quarter and said it expanded into nine new cities; 199 of the 360 stores operated under a franchisee model. The presentation does not provide a product-level sales split for those stores.
How does Stove Kraft’s H1 category trend compare with Q2 FY27?
Stove Kraft reported faster induction-cooktop growth in H1 FY27 at 188.9% than in Q2 FY27 at 108.0%, while gas cooktops declined 6.6% in H1 and 6.4% in Q2. These are growth rates for different periods, rather than a sequential comparison of Q1 and Q2 category sales.
Cooker growth was similar across the two periods, at 44.6% in H1 FY27 and 46.8% in Q2 FY27. Nonstick cookware rose 9.5% in H1 but fell 1.6% in Q2, while small appliances rose 4.7% in H1 and 9.1% in Q2. Stove Kraft did not disclose category unit volumes, selling prices or margins that would explain the differences.
The mix figures also differ between the periods: induction cooktops represented 32% in H1 FY27 and 18% in Q2 FY27, whereas small appliances represented 18% in H1 and 36% in Q2. Without Q1 FY27 category shares or category revenue in rupees, the source cannot show whether the change arose from Q1 sales composition, pricing, volumes, or the presentation methodology.
Conclusion
Stove Kraft’s H1 FY27 data show a sharp split within cooktops. Induction-cooktop sales grew 188.9% YoY and represented 32% of consolidated revenue, while gas-cooktop sales declined 6.6% and represented 5%. Induction was the fastest-growing disclosed category against H1 revenue growth of 30.8%, although the source does not disclose category-level revenue or profitability.
The next company updates will show whether induction maintains a high revenue share after accounting for its 18% share in Q2 FY27 and whether gas cooktops stabilise after their 6.4% quarterly decline. Stove Kraft’s disclosed retail expansion, including 16 Pigeon stores added in Q2 FY27 and presence in nine new cities, is another item to monitor because the presentation does not provide category sales from those outlets.