










LIC embedded value falls 1.95% as in-force value declines
Key highlights
- LIC’s H1 FY27 Indian embedded value was Rs 7,97,378 crore, down Rs 15,852 crore from H1 FY26.
- LIC’s value of in-force business fell Rs 64,221 crore year on year to Rs 6,13,314 crore.
- LIC’s adjusted net worth rose Rs 48,369 crore year on year to Rs 1,84,064 crore.
- LIC’s net VNB margin increased 4.7 percentage points to 22.3% in H1 FY27.
powered by IRIS
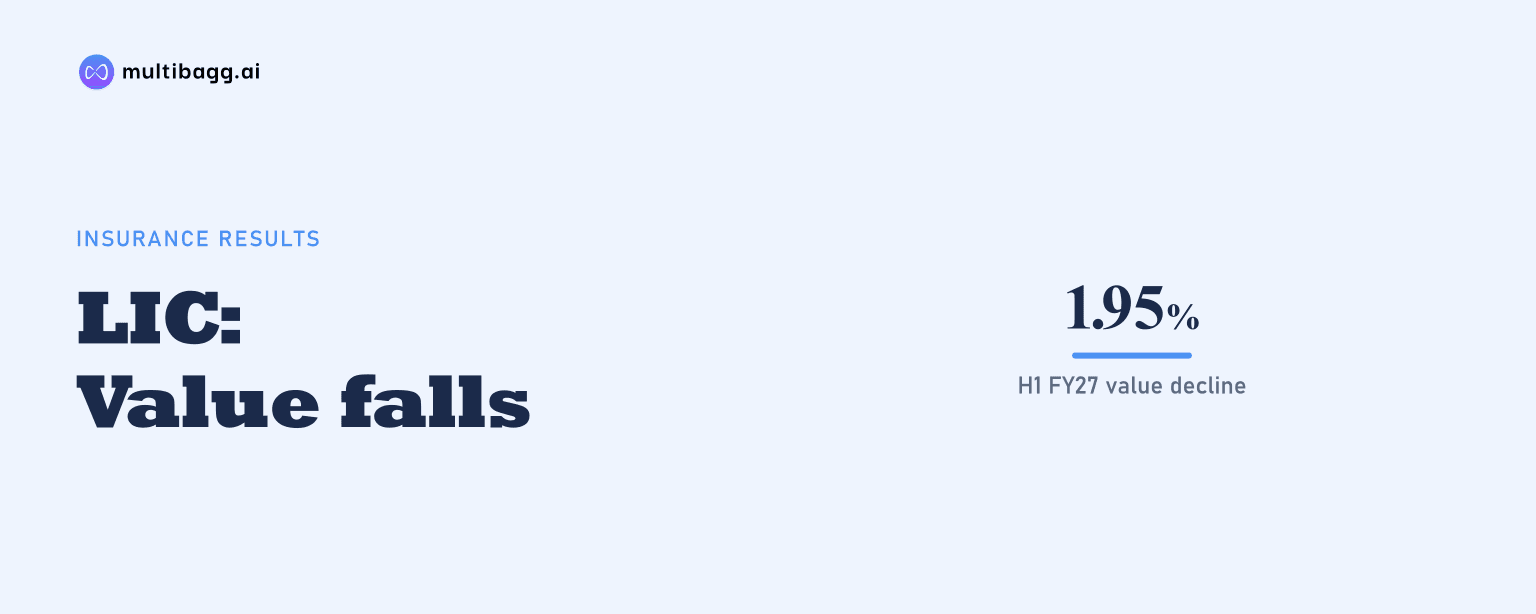
Life Insurance Corporation of India reported Indian embedded value of Rs 7,97,378 crore at September 30, 2026, 1.95% below the H1 FY26 figure of Rs 8,13,230 crore, because a Rs 64,221 crore fall in value of in-force business outweighed a Rs 48,369 crore increase in adjusted net worth.
Know Life Insurance Corporation of India inside out
Results, valuation, peers and who's buying, in one view.
Why did LIC’s embedded value fall year on year?
LIC’s Indian embedded value, or IEV, fell by Rs 15,852 crore between H1 FY26 and H1 FY27. IEV is the sum of adjusted net worth and the value of in-force, or VIF, business. The H1 FY26 comparison was Rs 8,13,230 crore, while the reported H1 FY27 value was Rs 7,97,378 crore, producing a calculated year-on-year decline of 1.95%.
The year-on-year movement differs from the change since the end of March 2026. LIC reported IEV of Rs 7,89,185 crore at March 2026 and Rs 7,97,378 crore at September 2026, an increase of Rs 8,193 crore or 1.04%. Thus, the H1 FY27 position improved by Rs 8,193 crore over the preceding March balance, but remained Rs 15,852 crore below the H1 FY26 level.
How did adjusted net worth and in-force value change at LIC?
LIC’s adjusted net worth, or ANW, rose 35.65% year on year to Rs 1,84,064 crore in H1 FY27 from Rs 1,35,695 crore in H1 FY26. This Rs 48,369 crore increase meant ANW represented about 23.1% of H1 FY27 IEV, compared with about 16.7% of the H1 FY26 total, based on the reported component values.
LIC’s VIF business value fell 9.48% to Rs 6,13,314 crore from Rs 6,77,535 crore. VIF remained the larger IEV component in both periods, but its share declined from about 83.3% in H1 FY26 to about 76.9% in H1 FY27. The Rs 64,221 crore VIF reduction exceeded the Rs 48,369 crore ANW addition by Rs 15,852 crore, which matches the decline in total IEV.
The disclosure gives the component movement but does not identify a separate operational or market driver for the Rs 64,221 crore VIF decline. It therefore supports a mechanical conclusion about the build-up: the higher ANW was insufficient to offset the lower value assigned to the existing in-force business. It does not, on its own, establish why the in-force valuation changed.
Got a follow-up? Ask IRIS
How sensitive is LIC’s embedded value to key assumptions?
LIC’s H1 FY27 sensitivity analysis starts with IEV of Rs 7,97,378 crore and a new-business margin of 22.3% at September 30, 2026. A 100-basis-point increase in reference rates would reduce IEV by 0.6% and increase new-business margin by 3.0 percentage points. A 100-basis-point decrease would increase IEV by 0.5% and reduce new-business margin by 4.4 percentage points.
The largest disclosed adverse IEV sensitivity is taxation: an assumed tax rate of 25% would reduce IEV by 9.4% and new-business margin by 3.0 percentage points. A 10% decline in equity values would reduce IEV by 6.0% and margin by 0.8 percentage points. The presentation does not state the base assumed tax rate or quantify the rupee effect of these percentage changes.
A 10% increase in maintenance expenses would reduce IEV by 0.5% and margin by 0.8 percentage points, while a 10% reduction would increase them by 0.5% and 0.8 percentage points, respectively. A 10% multiplicative increase in policy, premium-discontinuance and partial-withdrawal rates would lower IEV by 0.2% and margin by 1.2 percentage points. Acquisition-expense changes are marked not applicable for IEV, although a 10% increase lowers margin by 0.6 percentage points.
How did LIC’s new-business value and margin change?
LIC’s net value of new business, or VNB, rose 33.95% to Rs 6,846 crore in H1 FY27 from Rs 5,111 crore in H1 FY26. Total annualised premium equivalent, or APE, increased 5.72% to Rs 30,696 crore from Rs 29,034 crore. As a result, net VNB margin, calculated as net VNB divided by APE, increased to 22.3% from 17.6%, a 4.7-percentage-point improvement.
The H1 FY27 margin walk attributes 3.3 percentage points of the increase to business mix and 2.8 percentage points to assumptions, partly offset by a 1.4-percentage-point impact from expenses. Those reported changes bridge the opening 17.6% VNB margin at September 30, 2025 to 22.3% at September 30, 2026. The VNB and IEV measures are distinct: VNB concerns new business written in the period, while IEV includes ANW and VIF.
Group APE grew 13.55% to Rs 13,472 crore, while total individual APE was nearly unchanged at Rs 17,224 crore, up 0.31%. Within individual business, participating, or par, APE rose 3.91% to Rs 11,364 crore, whereas non-participating, or non-par, APE declined 5.98% to Rs 5,861 crore. The individual non-par share consequently fell to 34.02% in H1 FY27 from 36.31% a year earlier.
Conclusion
LIC’s H1 FY27 actuarial figures show two contrasting movements: ANW increased by Rs 48,369 crore and net VNB increased by Rs 1,735 crore, while VIF declined by Rs 64,221 crore. The VIF movement was larger than the ANW increase, leaving IEV at Rs 7,97,378 crore, below the H1 FY26 figure despite its Rs 8,193 crore rise from March 2026.
The next disclosures will show whether LIC’s stated focus on consolidating its increased share of non-par products changes the individual business mix, whose non-par share was 34.02% in H1 FY27. Readers can also watch the next IEV build-up against the disclosed sensitivity to a 25% tax assumption and a 10% equity-value decline, which would reduce IEV by 9.4% and 6.0%, respectively.