










LIC’s H1 FY27 new-business margin reaches 22.3%, VNB up 34%
Key highlights
- LIC’s net VNB rose 33.95% to Rs 6,846 crore in H1 FY27.
- LIC’s net VNB margin increased to 22.3% from 17.6%, a 4.7-percentage-point rise.
- Business mix and assumptions added 6.1 percentage points to LIC’s margin walk, while expenses reduced it by 1.4 percentage points.
- LIC’s group APE rose 13.55% to Rs 13,472 crore, while total individual APE increased 0.31%.
powered by IRIS
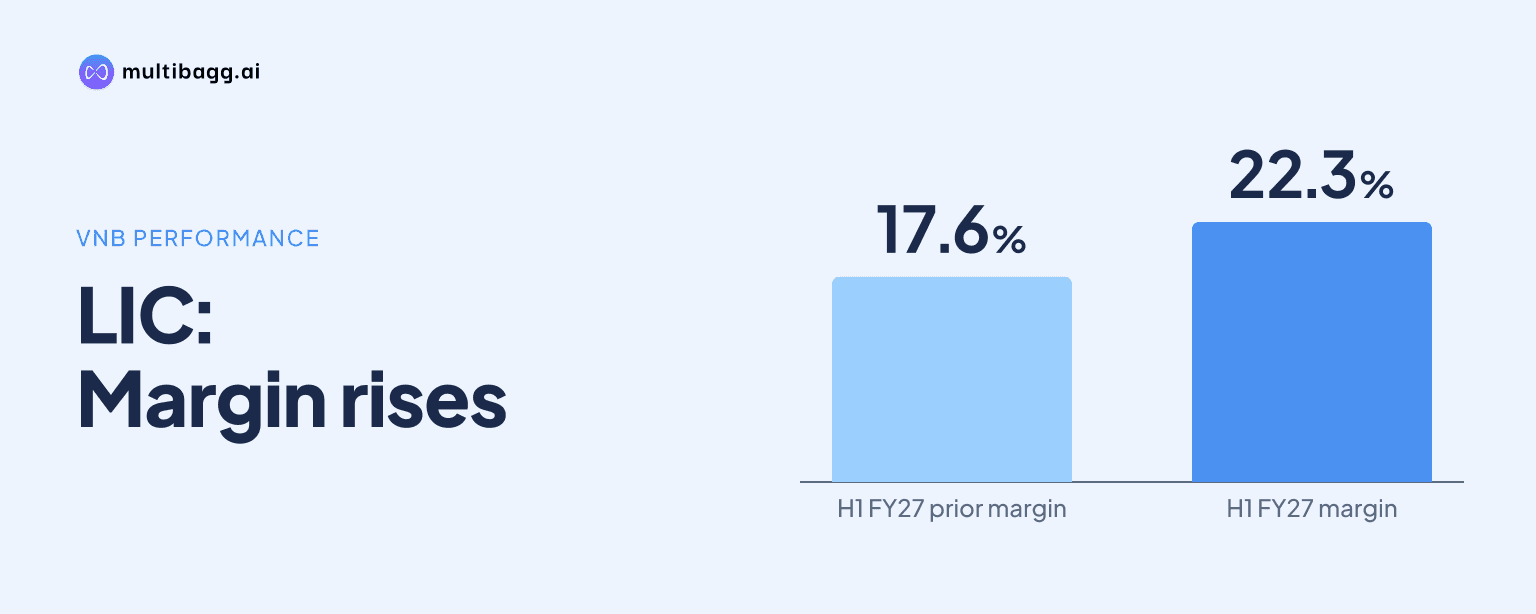
Life Insurance Corporation of India reported a 22.3% new-business margin in H1 FY27, up 4.7 percentage points from 17.6% a year earlier, as net value of new business rose 33.95% to Rs 6,846 crore while annualized premium equivalent increased 5.72% to Rs 30,696 crore.
Know Life Insurance Corporation of India inside out
Results, valuation, peers and who's buying, in one view.
How did LIC’s new-business profitability change in H1 FY27?
LIC’s new-business profitability increased faster than its sales measure in H1 FY27. Net value of new business, or VNB, increased by Rs 1,735 crore year on year, from Rs 5,111 crore in H1 FY26 to Rs 6,846 crore in H1 FY27. The VNB margin, calculated as net VNB divided by annualized premium equivalent, or APE, rose from 17.6% to 22.3%, an absolute increase of 4.7 percentage points.
APE, the premium-equivalent measure used in the presentation, rose by Rs 1,662 crore to Rs 30,696 crore in H1 FY27 from Rs 29,034 crore in H1 FY26. This 5.72% increase was substantially lower than the 33.95% rise in VNB. The reported figures indicate that LIC generated more VNB for each rupee of APE than in the comparable half year.
Which LIC business segments increased APE during H1 FY27?
LIC’s group business was the main contributor to APE growth, while total individual APE was broadly flat. Group APE rose 13.55% to Rs 13,472 crore in H1 FY27 from Rs 11,864 crore in H1 FY26, adding Rs 1,608 crore. Total individual APE increased 0.31% to Rs 17,224 crore from Rs 17,170 crore, an increase of Rs 54 crore.
Within individual business, participating, or Par, APE grew 3.91% to Rs 11,364 crore, while individual non-Par APE declined 5.98% to Rs 5,861 crore. Individual savings APE rose 35.02% to Rs 3,034 crore and protection APE increased 58.59% to Rs 157 crore. In contrast, unit-linked insurance plan, or ULIP, APE fell 40.07% to Rs 1,880 crore from Rs 3,137 crore, a decline of Rs 1,257 crore.
The segment comparison shows that group business contributed nearly all of the Rs 1,662 crore increase in total APE, whereas changes within individual products offset one another. LIC’s individual non-Par share of individual APE also moved down to 34.02% in H1 FY27 from 36.31% in H1 FY26. The Par share consequently increased to 65.98% from 63.69% over the same periods.
Got a follow-up? Ask IRIS
What drove LIC’s H1 FY27 VNB margin increase?
LIC’s VNB margin walk attributes the 4.7-percentage-point increase to business mix, assumptions and expenses. Business mix added 3.3 percentage points to the margin, while the impact of assumptions added 2.8 percentage points. These two items together contributed 6.1 percentage points between the 17.6% opening margin as at September 30, 2025 and the 22.3% margin as at September 30, 2026.
Expenses reduced the margin by 1.4 percentage points, partly offsetting the two positive components. The walk therefore reconciles the 6.1-percentage-point positive effect from mix and assumptions with the expense impact to arrive at the reported net improvement of 4.7 percentage points. LIC does not provide a further numerical breakdown of the individual assumptions or expense items in the VNB walk.
The movement in product sales and the reported mix effect should be read separately. Individual non-Par APE declined by Rs 373 crore and its share of individual APE fell by 2.29 percentage points, even as the VNB walk records a 3.3-percentage-point benefit from business mix. The presentation reports both measures but does not assign the mix impact to particular product lines, channels or customer segments.
How sensitive is LIC’s H1 FY27 margin to assumptions and expenses?
LIC’s reported 22.3% H1 FY27 VNB margin is sensitive to changes in rates, expenses, policy discontinuance, taxation and equity values under the presentation’s scenarios. A 100-basis-point increase in reference rates would raise the margin by 3.0 percentage points, while a 100-basis-point decrease would lower it by 4.4 percentage points. A basis point is one-hundredth of a percentage point.
The scenario analysis shows that a 10% increase in acquisition expenses would reduce the margin by 0.6 percentage points, and a 10% increase in maintenance expenses would lower it by 0.8 percentage points. A 10% multiplicative increase in policy or premium discontinuance rates and partial withdrawal rates would reduce the margin by 1.2 percentage points. Conversely, a 10% decrease in discontinuance and withdrawal rates would add 1.3 percentage points.
Taxation produces the largest stated margin effect among the listed non-rate scenarios. Raising the assumed tax rate to 25% would reduce the 22.3% margin by 3.0 percentage points. A 10% fall in equity values would reduce it by 0.8 percentage points, while a 5% increase in mortality or morbidity rates would reduce it by 0.2 percentage points.
Conclusion
LIC’s H1 FY27 figures show a 4.7-percentage-point expansion in new-business margin alongside a Rs 1,735 crore increase in net VNB. Group APE growth of Rs 1,608 crore supported the 5.72% rise in total APE, while the margin walk identifies business mix and assumptions as adding 6.1 percentage points before a 1.4-percentage-point expense offset.
What to watch next is whether LIC can sustain the reported 22.3% margin as product and group-business volumes change. The presentation does not identify the specific products or channels behind the 3.3-percentage-point mix benefit, while its scenarios show that reference-rate movements, a 25% assumed tax rate and expense changes would alter the reported margin.