










LIC premium rises 11.64% as policy share drops 2.61 points
Key highlights
- LIC’s total premium income rose 11.64% to Rs 2,74,269 crore in H1 FY27.
- LIC’s market share in policies fell 2.61 percentage points to 60.83% in H1 FY27.
- LIC sold 70,97,094 individual policies in H1 FY27, down 2.25% year on year.
- LIC’s profit after tax increased 21.52% to Rs 25,568 crore in H1 FY27.
powered by IRIS
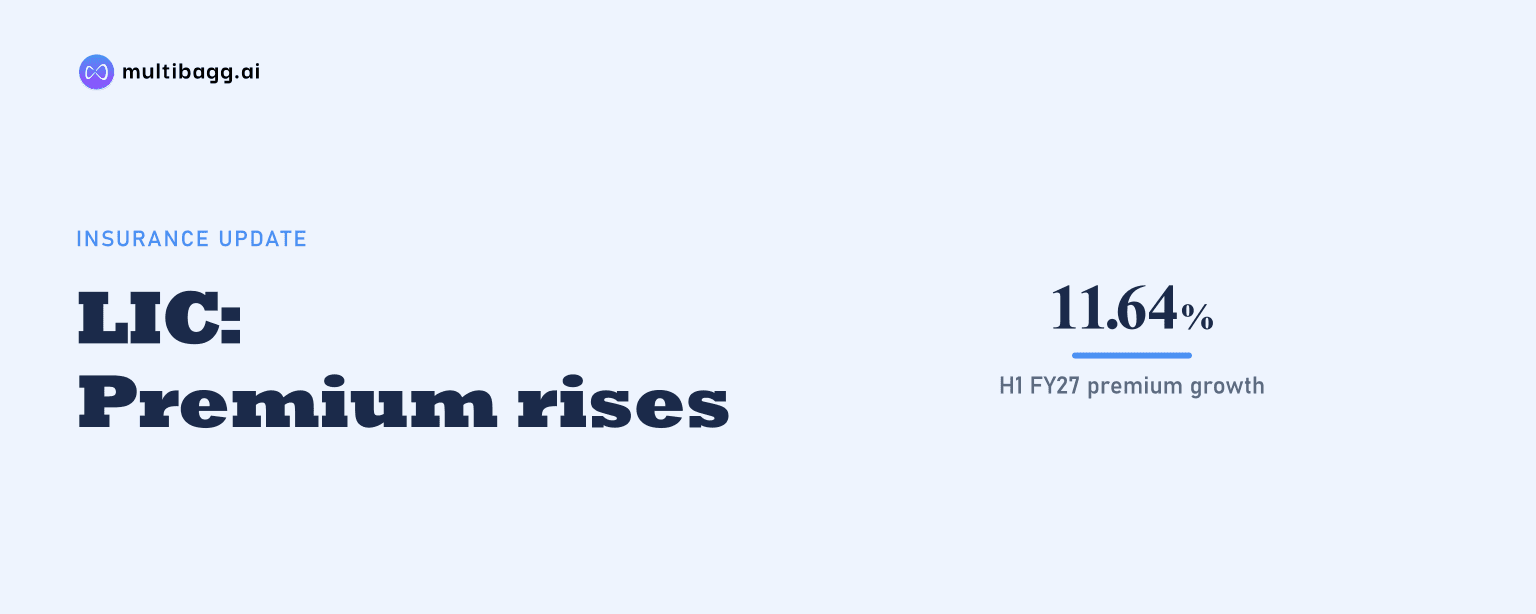
Life Insurance Corporation of India reported total premium income of Rs 2,74,269 crore in H1 FY27, up 11.64% year on year, while its market share in policies fell 2.61 percentage points to 60.83%. LIC also sold 70,97,094 individual policies, 2.25% fewer than in H1 FY26, even as profit after tax rose 21.52%.
Know Life Insurance Corporation of India inside out
Results, valuation, peers and who's buying, in one view.
How did LIC’s premium income change in H1 FY27?
LIC’s total premium income increased by Rs 28,589 crore to Rs 2,74,269 crore in H1 FY27 from Rs 2,45,680 crore in H1 FY26. The 11.64% increase was supported by total group-business premium growth of 19.62%, which took group-business premium to Rs 1,13,594 crore from Rs 94,965 crore.
Individual new-business premium rose 14.86% to Rs 32,725 crore from Rs 28,491 crore a year earlier. Individual renewal premium increased at a slower 4.68% to Rs 1,27,950 crore from Rs 1,22,224 crore, so LIC’s individual new-business premium grew faster than its renewal premium during H1 FY27.
Why did LIC’s market share decline despite premium growth?
LIC’s market share measured by premium declined by 0.64 percentage points to 58.77% in H1 FY27 from 59.41% in H1 FY26. The market-share figures are based on Life Insurance Council data, while LIC’s own total premium income rose 11.64% over the same period.
LIC’s market share measured by policies declined by a larger 2.61 percentage points to 60.83% from 63.44%. The policy-share reduction was 1.97 percentage points greater than the 0.64-percentage-point decline in premium share, indicating that LIC’s relative movement was more pronounced in policy count than in premium value.
What happened to LIC’s individual policy sales and new-business measures?
LIC sold 70,97,094 individual policies in H1 FY27, down 2.25% from 72,60,573 in H1 FY26. This reduction of 1,63,479 policies occurred in the same half year as the 2.61-percentage-point decline in LIC’s market share in policies.
LIC’s reported premium and sum-assured measures increased despite the lower policy count. Individual weighted received premium rose 14.50% to Rs 17,510 crore from Rs 15,293 crore, while total individual new-business sum assured increased 5.16% to Rs 2,59,900 crore from Rs 2,47,140 crore.
LIC’s bancassurance and alternate channels sold 1,08,789 policies in H1 FY27, down 2.94% from 1,12,082 a year earlier. The presentation does not identify the contribution of these channels to the overall reduction in individual policies, but both disclosed policy-count measures fell year on year.
Got a follow-up? Ask IRIS
How did LIC’s profit, claims and solvency change?
LIC’s profit after tax rose 21.52% to Rs 25,568 crore in H1 FY27 from Rs 21,040 crore in H1 FY26. Assets under management increased 4.16% to Rs 59,60,941 crore from Rs 57,22,896 crore, while the solvency ratio increased to 2.35 from 2.13, an absolute rise of 0.22.
Individual death-claim payments rose 5.33% to Rs 12,691 crore, although the number of individual death claims fell 0.26% to 4,08,880. Maturity-claim payments increased 16.93% to Rs 1,25,806 crore, while the number of maturity claims declined 14.55% to 78,90,878.
LIC’s death claim-settlement ratio was 96.74% in H1 FY27, compared with 97.25% in H1 FY26, a 0.51-percentage-point decline. LIC states that the ratio includes unclaimed amounts of the last 10 years that were brought back to outstanding in previous years under Insurance Regulatory and Development Authority of India regulations.
Which operating and value measures changed for LIC?
LIC’s overall expense ratio declined by 0.87 percentage points to 10.41% in H1 FY27 from 11.28% in H1 FY26. Its total gross non-performing asset ratio fell by 0.18 percentage points to 1.16%, while its conservation ratio declined by 0.95 percentage points to 90.20% from 91.15%.
The yield on LIC’s policyholders’ fund declined by 0.23 percentage points to 8.67%, while the yield on its shareholders’ fund increased by 0.06 percentage points to 6.54%. LIC reports the shareholders’ fund yield without unrealised gains, and the presentation identifies the two yields as applying to separate funds.
LIC’s Indian embedded value was Rs 7,97,378 crore at September 2026, up Rs 8,193 crore, or 1.04%, from Rs 7,89,185 crore at March 2026. Compared with the H1 FY26 Indian embedded value of Rs 8,13,230 crore, adjusted net worth increased to Rs 1,84,064 crore from Rs 1,35,695 crore, while value of in-force business declined to Rs 6,13,314 crore from Rs 6,77,535 crore.
What products did LIC launch in H1 FY27?
LIC launched five non-participating products in H1 FY27, including two LIC’s New Jeevan Sathi variants introduced on 1 June 2026. The single-premium and limited-premium versions are joint-life endowment products, while LIC’s New Bima Jyoti, introduced on 10 August 2026, is a limited-premium-payment endowment product.
On 7 September 2026, LIC introduced LIC’s New Jeevan Raksha, a pure-risk plan, and LIC’s Bima Platinum, a limited-premium-payment endowment product. The presentation describes all five launches as non-linked, individual life products; it does not quantify their contribution to H1 FY27 premium income or policy sales.
Conclusion
LIC’s H1 FY27 results show higher premium income, individual new-business premium and profit alongside lower individual policy sales and declining market share in both premium and policies. Total premium rose 11.64%, but market share in policies fell to 60.83% and individual policies sold declined 2.25%, highlighting the difference between premium growth and policy-volume trends.
The next disclosures should clarify whether the five non-participating products launched between 1 June 2026 and 7 September 2026 affect individual policy volumes, premium mix and market-share trends. LIC’s presentation does not assign a cause for the 2.61-percentage-point decline in policy market share or provide a target for reversing it.