










Niva Bupa H1 profit more than doubled as ratio reached 99.5%
Key highlights
- Niva Bupa reported H1’FY2027 profit after tax of ₹273.4 crore, up 107% from ₹132.0 crore.
- Niva Bupa’s H1’FY2027 combined insurance service ratio improved to 99.5% from 103.1%.
- Niva Bupa’s insurance service result increased to ₹226.9 crore from ₹53.1 crore in H1’FY2026.
- Niva Bupa’s retail health gross written premium grew 46.9% to ₹3,483.5 crore on the 1/n basis.
powered by IRIS
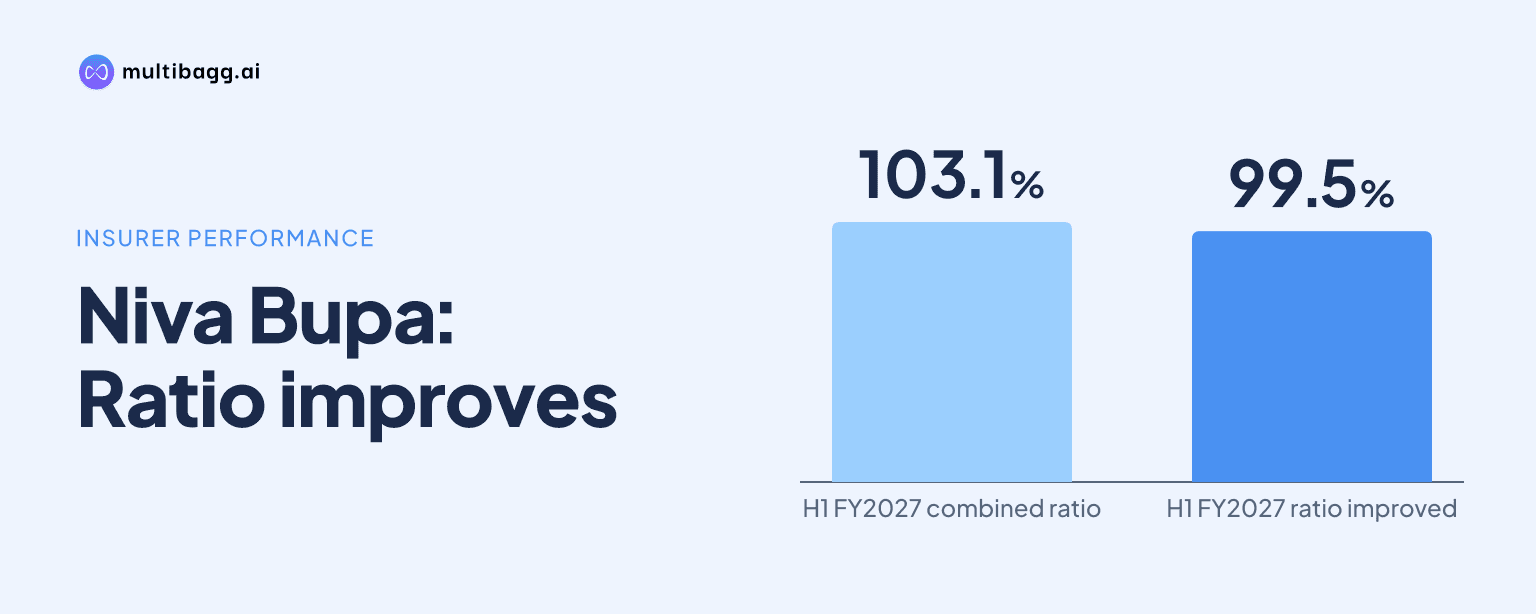
Niva Bupa Health Insurance reported profit after tax of ₹273.4 crore in H1’FY2027, up 107% from ₹132.0 crore a year earlier, as its combined insurance service ratio improved by 365 basis points to 99.5% from 103.1%. Its insurance service result increased to ₹226.9 crore from ₹53.1 crore.
Know Niva Bupa Health Insurance Company inside out
Results, valuation, peers and who's buying, in one view.
How did Niva Bupa’s H1’FY2027 profit change?
Niva Bupa’s profit after tax more than doubled to ₹273.4 crore in H1’FY2027 from ₹132.0 crore in H1’FY2026. Profit before tax rose to ₹365.3 crore from ₹179.7 crore, while income tax increased to ₹91.8 crore from ₹47.7 crore. In Q2’FY2027, profit after tax was ₹135.6 crore, compared with ₹60.5 crore in Q2’FY2026.
The half-year result followed profit after tax of ₹202.9 crore in FY2025 and ₹365.2 crore in FY2026. The presentation reports quarterly profit after tax of ₹137.8 crore in Q1’FY2027 and ₹135.6 crore in Q2’FY2027, indicating similar contributions from the two quarters.
Investment income rose by ₹44.5 crore to ₹357.2 crore in H1’FY2027, while the insurance service result increased by ₹173.8 crore. Net other income and expense was an outflow of ₹218.8 crore, compared with an outflow of ₹186.2 crore a year earlier. The improvement in the insurance service result was therefore a larger contributor to the change in profit than the increase in investment income.
Why did Niva Bupa’s combined insurance service ratio fall below 100%?
Niva Bupa’s combined insurance service ratio, or CISR, declined to 99.5% in H1’FY2027 from 103.1% in H1’FY2026. That 3.6-percentage-point, or 365-basis-point, reduction reflected a lower claims ratio and a lower expense ratio. Niva Bupa defines CISR as claims ratio plus expense ratio in its financial-performance presentation.
The claims ratio fell to 63.1% from 65.9%, accounting for 2.8 percentage points of the CISR movement. The expense ratio declined to 36.4% from 37.2%, accounting for the remaining 0.8 percentage points. In Q2’FY2027, CISR was 98.8%, compared with 103.1% in Q2’FY2026, with a claims ratio of 63.1% and expense ratio of 35.7%.
Insurance revenue increased 27.8% to ₹4,686.0 crore in H1’FY2027, while incurred claims and expenses rose 22.2% to ₹2,954.6 crore. Amortized insurance acquisition cost rose 22.9% to ₹1,370.6 crore, and other expenses related to insurance contracts increased to ₹50.1 crore from ₹43.4 crore. The difference in growth rates contributed to the higher insurance service result.
What changed in Niva Bupa’s claims experience?
Niva Bupa’s retail claims ratio was 67.4% in H1’FY2027, down from 68.1% in H1’FY2026 but above its overall claims ratio of 63.1%. Both ratios include claim-handling expenses, according to the presentation. The retail health claims cost index reached 163 in H1’FY2027, compared with 160 in FY2026 and 153 in FY2025, with FY2019 indexed at 100.
The company says the claims cost index reflects year-on-year average claim size for indemnity claims excluding Covid claims. It attributes movements in the index to medical-cost inflation, changes in disease mix and medical advancement, among other factors. The index recorded a compound annual growth rate of 6.8% from FY2019 to H1’FY2027 and 5.3% from FY2021 to FY2026.
Niva Bupa lists preferred-partner hospitals, automated adjudication, fraud and outlier detection, billing review and case management among its claims-management mechanisms. Its hospital network increased to 10,780 in H1’FY2027 from 10,566 in FY2026. The preferred partner network rose to 1,132 hospitals from 1,116, while claims contribution in preferred-partner-network cities increased to 22% from 21%.
Got a follow-up? Ask IRIS
How did Niva Bupa’s premium mix develop in H1’FY2027?
Niva Bupa reported gross written premium of ₹4,634.0 crore in H1’FY2027 under the 1/n accounting basis, compared with ₹3,475.0 crore in H1’FY2026. Retail health gross written premium increased 46.9% to ₹3,483.5 crore from ₹2,371.8 crore. Niva Bupa says long-term products have been accounted for on a 1/n basis from October 1, 2024, as mandated by the Insurance Regulatory and Development Authority of India.
Retail health represented 75.2% of gross written premium in H1’FY2027, up from 68.2% a year earlier. Group health’s share declined to 23.4% from 30.2%, while personal accident and travel accounted for 1.4%, compared with 1.6%. Retail health market share rose to 11.0% from 9.9% over the same period.
On the presentation’s basis without 1/n, gross written premium was ₹5,004.1 crore in H1’FY2027, up from ₹3,982.7 crore in H1’FY2026. Retail health gross written premium on that basis increased 37.1% to ₹3,853.7 crore. Policies with sum insured of at least ₹10 lakh contributed 93.2% of new retail health indemnity premium, compared with 83.8% a year earlier.
Which operating indicators could affect Niva Bupa’s next results?
Niva Bupa had 225 branches, 269,175 individual agents, 137 banca and other corporate agents, 623 brokers and 11,200 employees as of H1’FY2027. Individual agents accounted for 33.0% of channel mix, up from 30.6% in H1’FY2026. Brokers accounted for 26.9%, down from 28.0%, while direct sales increased to 11.5% from 10.5%.
Digital measures included 100.0% of new policies applied through the website and mobile applications, 96.9% digital payments and 50.8% of retail policies auto-decisioned in H1’FY2027. Cashless claims auto-adjudication was 39.1% on an exit basis, compared with 12.5% a year earlier. Niva Bupa says auto-adjudication was on hold in Q1’FY2026 during information-security assurance reviews across third parties.
Niva Bupa also reported that 90.6% of cashless claims were processed in under 30 minutes in H1’FY2027, compared with 73.6% in H1’FY2026. Its stated artificial intelligence plans for FY2027 include a sales copilot, underwriter copilot, document summarization, risk prediction, renewal next-best-action tools and technology projects including enterprise search and systems reliability.
Conclusion
Niva Bupa’s H1’FY2027 profit increase to ₹273.4 crore coincided with CISR moving below 100% to 99.5%, from 103.1% a year earlier. The lower claims ratio of 63.1% and expense ratio of 36.4% supported an insurance service result of ₹226.9 crore, while retail health premium grew 46.9% on the 1/n basis.
The disclosed FY2027 technology and artificial-intelligence projects are the next operational developments to watch, alongside claims costs. Niva Bupa’s retail health claims cost index increased to 163 in H1’FY2027 from 160 in FY2026, even as its preferred partner network expanded to 1,132 hospitals.