










Niva Bupa quarterly profit more than doubles to Rs 135.64 crore
Key highlights
- Niva Bupa's September-quarter profit after tax rose to Rs 135.64 crore from Rs 60.52 crore a year earlier.
- Niva Bupa's combined operating ratio declined to 93.20% from 96.62% in the September 2025 quarter.
- Niva Bupa's insurance revenue increased to Rs 2,412.27 crore from Rs 1,899.07 crore year on year.
- Niva Bupa's health segment profit rose to Rs 125.87 crore from Rs 53.37 crore a year earlier.
powered by IRIS
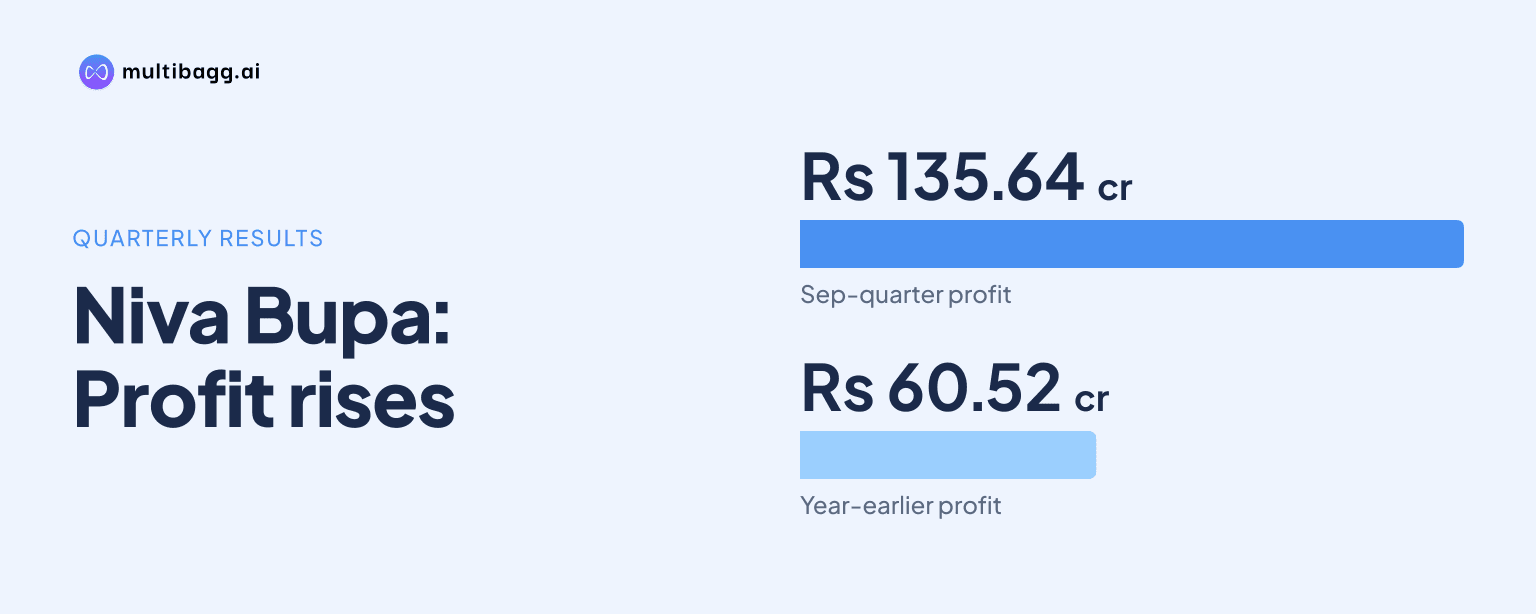
Niva Bupa Health Insurance Company Limited reported profit after tax of Rs 135.64 crore for the quarter ended September 30, 2026, more than double Rs 60.52 crore a year earlier. The unaudited result reflected an insurance service result of Rs 125.99 crore and a combined operating ratio of 93.20%, down from 96.62%.
Know Niva Bupa Health Insurance Company inside out
Results, valuation, peers and who's buying, in one view.
What drove Niva Bupa's September-quarter profit growth?
Niva Bupa's profit after tax rose by Rs 75.12 crore year on year to Rs 135.64 crore in the quarter ended September 30, 2026, while profit before tax increased to Rs 181.53 crore from Rs 81.74 crore. Deferred-tax expense was Rs 45.89 crore, compared with Rs 21.22 crore in the corresponding quarter of 2025, and the company reported no exceptional items in either period.
Insurance revenue increased to Rs 2,412.27 crore from Rs 1,899.07 crore a year earlier. Total insurance service expenses also rose, to Rs 2,248.17 crore from Rs 1,834.79 crore, but the increase in revenue exceeded that in expenses. As a result, the insurance service result rose to Rs 125.99 crore from Rs 45.54 crore, despite net expenses from reinsurance contracts increasing to Rs 38.11 crore from Rs 18.74 crore.
Niva Bupa's profit after tax was Rs 2.16 crore lower than Rs 137.80 crore in the preceding quarter ended June 30, 2026, although insurance revenue rose by Rs 138.55 crore sequentially. The net finance result declined by Rs 37.93 crore to Rs 159.61 crore, while other investment revenue moved to a loss of Rs 17.57 crore from income of Rs 25.58 crore in the June quarter.
How did Niva Bupa's underwriting metrics change?
Niva Bupa reported a combined operating ratio, or CoR, of 93.20% for the September 2026 quarter, compared with 96.62% a year earlier and 93.55% in the June 2026 quarter. The reported CoR therefore fell by 3.42 percentage points year on year and by 0.35 percentage points sequentially.
The claims ratio was 63.09%, down from 65.08% in the September 2025 quarter, while the expense ratio declined to 30.10% from 31.53%. Against the June 2026 quarter, the claims ratio increased by 0.08 percentage points from 63.01%, but the expense ratio decreased by 0.44 percentage points from 30.54%.
Insurance service margin rose to 6.80% from 3.38% a year earlier and from 6.45% in the preceding quarter. Net insurance margin was 11.84%, above 10.27% in the September 2025 quarter but below 13.13% in the June 2026 quarter. Niva Bupa defines net insurance margin as insurance service result plus net finance result, divided by insurance revenue.
Got a follow-up? Ask IRIS
Which Niva Bupa segments generated September-quarter profit?
Niva Bupa's health segment generated profit of Rs 125.87 crore in the September quarter, up from Rs 53.37 crore a year earlier and accounting for most of total profit of Rs 135.64 crore. Health insurance revenue increased to Rs 2,375.34 crore from Rs 1,856.87 crore, while health insurance service expenses rose to Rs 2,227.24 crore from Rs 1,812.23 crore.
The personal accident segment reported profit of Rs 9.31 crore, compared with Rs 10.61 crore in the year-earlier quarter. Its insurance revenue declined to Rs 32.38 crore from Rs 37.90 crore, while insurance service expenses increased to Rs 18.46 crore from Rs 17.73 crore. Net expenses from reinsurance contracts narrowed to Rs 2.27 crore from Rs 6.35 crore.
The travel segment reported profit of Rs 0.46 crore, compared with a loss of Rs 3.46 crore a year earlier. Travel insurance revenue rose to Rs 4.55 crore from Rs 4.30 crore, while insurance service expenses fell to Rs 2.47 crore from Rs 4.83 crore. Net expenses from reinsurance contracts narrowed to Rs 1.54 crore from Rs 4.18 crore.
What changed in Niva Bupa's balance sheet and capital measures?
Niva Bupa's total assets stood at Rs 12,127.83 crore at September 30, 2026, compared with Rs 11,485.56 crore at March 31, 2026. Investments increased to Rs 10,659.32 crore from Rs 9,875.90 crore over the six months, while cash and cash equivalents decreased to Rs 90.37 crore from Rs 158.66 crore.
Insurance contract liabilities increased to Rs 6,938.56 crore at September 30 from Rs 6,562.62 crore at March 31. Total equity rose to Rs 3,843.16 crore from Rs 3,589.27 crore, comprising share capital of Rs 1,849.64 crore and other equity of Rs 1,993.52 crore. Total liabilities were Rs 8,284.67 crore, compared with Rs 7,896.29 crore six months earlier.
Niva Bupa's solvency ratio was 2.03 at September 30, 2026, compared with 2.49 at March 31, 2026 and 2.85 a year earlier. Basic earnings per share were Rs 0.73 for the September quarter, up from Rs 0.33 a year earlier but below Rs 0.75 in the June quarter. Return on equity was 3.53%, compared with 1.75% in the September 2025 quarter.
Conclusion
Niva Bupa combined year-on-year insurance revenue growth of Rs 513.20 crore with an Rs 80.45 crore increase in insurance service result. Lower claims and expense ratios from the prior-year quarter coincided with a lower CoR and a Rs 75.12 crore increase in profit after tax, while the health segment contributed Rs 125.87 crore of segment profit.
The next quarterly disclosure will show whether Niva Bupa can maintain a CoR of 93.20% and insurance service margin of 6.80%, particularly after the claims ratio rose slightly from 63.01% in the June quarter to 63.09%. The next update will also indicate whether the solvency ratio, which was 2.03 at September 30, 2026, changes from its March 31, 2026 level of 2.49.