










Niva Bupa ties lower retail loss ratio to new cohorts
Key highlights
- Niva Bupa's H1 '27 retail loss ratio declined 77 basis points year on year to 67.4%.
- Niva Bupa said its renewal-book claims ratio remained around 75% in H1 '27.
- Niva Bupa's combined insurance service ratio improved 365 basis points to 99.5% in H1 '27.
- Niva Bupa's preferred provider network covered 1,132 hospitals in 49 cities, with 22% of cashless claims at those hospitals using the network.
powered by IRIS
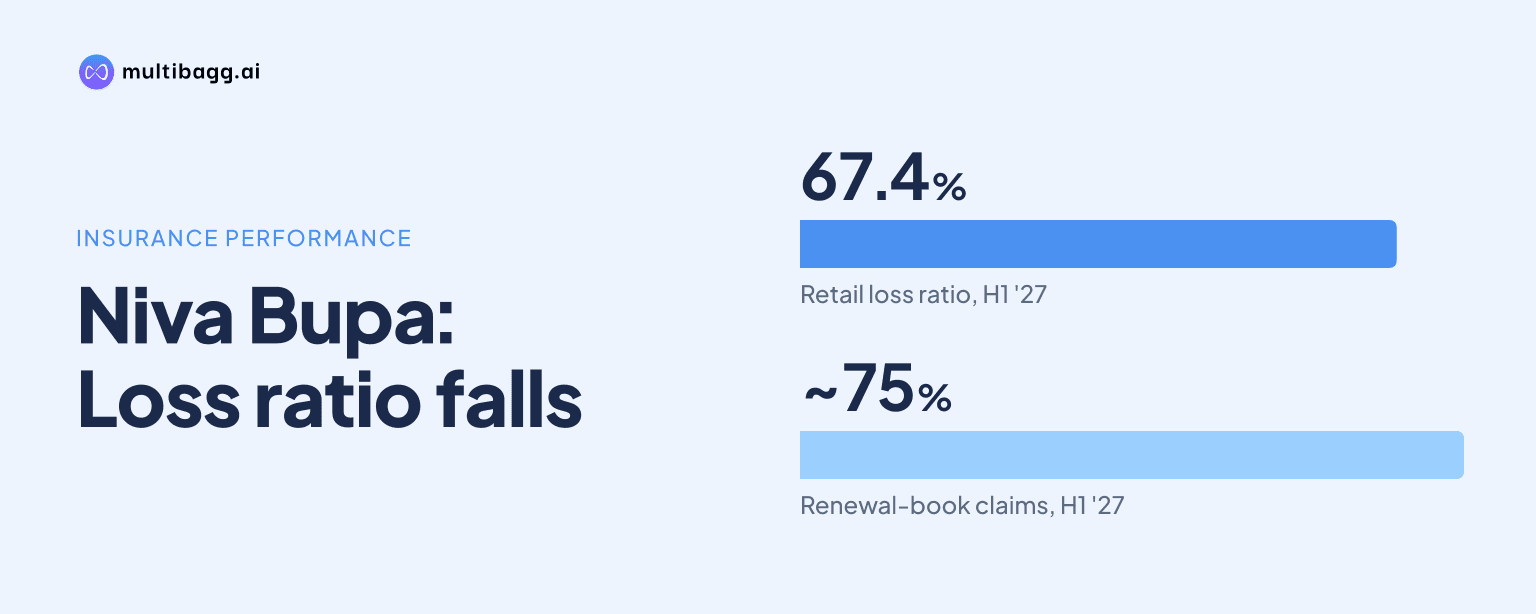
In H1 '27, Niva Bupa said improved claims experience in newer retail cohorts lowered its retail loss ratio by 77 basis points year on year to 67.4%, while its mature renewal book continued to report a claims ratio of about 75%. Management attributed the change chiefly to the quality and mix of fresh business.
Know Niva Bupa Health Insurance Company inside out
Results, valuation, peers and who's buying, in one view.
Why is Niva Bupa's retail loss ratio falling?
Niva Bupa said the main reason for the lower retail loss ratio was the improved claims experience of business written over the previous two or three quarters. Management said fresh-business claims ratios had improved from historical levels, whereas the renewal-book claims ratio remained around 75%. It linked the newer cohort's performance to better-quality underwriting and a larger share of policies with higher sums insured.
The retail loss ratio fell by 77 basis points to 67.4% in H1 '27. A basis point is one-hundredth of a percentage point, making the reduction 0.77 percentage points. At the company level, the claims-ratio component of the combined insurance service ratio declined by 287 basis points, while the combined insurance service ratio improved by 365 basis points to 99.5%.
Management said infection experience was broadly in line with the average of the last three years and slightly below the previous financial year. It said this had contributed to the result, but did not quantify its effect relative to newer-business quality. Niva Bupa also said it could not separate the effects of lower infections, wellness activity and underwriting changes on the H1 '27 claims outcome.
Is Niva Bupa's renewal book improving too?
Niva Bupa said its renewal-book claims ratio continued to run at around 75%, with only possible marginal improvement. This means the H1 '27 reduction in the retail loss ratio was principally associated with fresh cohorts, rather than a substantial change in the claims profile of the established portfolio. Management described the renewal book as stable on this measure.
The company distinguished claims ratios from combined ratios, which include claims and expenses. It said new business has an indicative combined ratio of 102% to 103%, compared with about 97% to 98% for renewal business. Management said renewal policies carry lower acquisition and new-business expenses, explaining why their combined ratio is lower even as the fresh book's claims ratio improves.
Niva Bupa said the age mix of incoming business is similar to that of earlier years, despite the increase in higher-sum-insured policies. Management said age is a rating factor, so premiums are adjusted for the claims experience of each age band. While the back book ages as customers renew, the company said its pricing reflects that age-band progression.
How are product mix and retail growth affecting results?
Niva Bupa said the proportion of higher-sum-insured policies in fresh business had risen materially, particularly through its ReAssure 3.0 product. Management said this mix represented an improvement in the quality of the new book rather than a shift towards lower-ticket policies. It did not disclose the average sum insured, the share of high-sum-insured policies, or a numerical claims ratio for fresh cohorts.
Retail business represented 77% of Niva Bupa's book at the end of H1 '27, up from about 75% at the end of Q1. Retail growth excluding the 1/n accounting effect was 37%, reaching about Rs 3,800 crore in gross written premium, while overall gross written premium increased 26% to Rs 5,004 crore. The growing retail share increases the relevance of fresh retail underwriting to the company's total claims results.
Niva Bupa's retail market share rose to 11% in H1 '27 from 9.9% in the corresponding prior-year period. Its claims settlement rate was 95.6%, compared with 94.6% a year earlier. Management did not provide a settlement-rate split between new and renewal retail policies, or between policies with different levels of sum insured.
Got a follow-up? Ask IRIS
Can wellness and care networks explain the change?
Niva Bupa said wellness programmes may support claims performance over time, but they were not a separately quantified reason for the H1 '27 retail loss-ratio improvement. Management said healthy-living interventions need sustained engagement before their effects become visible in claims ratios. It therefore did not attribute the 67.4% ratio solely to wellness programmes.
The company also identified its preferred provider network, or PPN, as a claims-cost management mechanism. Its PPN covered 1,132 hospitals in 49 cities at the H1 '27 update, and 22% of cashless claims in those hospitals went through the PPN arrangement. Management said PPN hospitals were 15% to 20% less expensive on a like-for-like basis than tertiary and quaternary care facilities.
Industry-led measures could also influence treatment costs over time, but Niva Bupa did not assign a financial contribution to them in H1 '27. Management said common empanelment had resulted in more than 5,000 hospital memorandums of understanding, with an initial focus on smaller and medium hospitals. Eight infectious-disease standard treatment workflows had gone live, with 18 more being added, and management said the protocols apply across hospital sizes.
How does the retail performance compare with Niva Bupa's wider business?
Niva Bupa's retail loss ratio of 67.4% formed part of the wider combined insurance service ratio improvement to 99.5% in H1 '27. The 365-basis-point change comprised a 287-basis-point decline in the claims ratio and a 78-basis-point fall in the expense ratio. Claims therefore accounted for the larger part of the reported movement in the combined insurance service ratio.
Management said group business was flat or declining because it would not write business when pricing did not meet its combined-ratio requirements. It described business-to-business operations as a smaller portion of its overall book. The rise in retail to 77% of the book, from about 75% at Q1-end, makes retail cohort quality the more direct explanation for the company's reported claims trend.
Niva Bupa reported profit after tax of Rs 273 crore under Indian Accounting Standards, or Ind AS, in H1 '27, compared with Rs 132 crore in the prior-year period. Its expense of management ratio declined to 34.7% from 38%, below the allowable 36.1% including additional allowances. Those changes accompanied the improvement in claims and expense components of the combined insurance service ratio.
Conclusion
Niva Bupa's H1 '27 explanation is that better-quality new retail business, including a greater proportion of higher-sum-insured policies, improved fresh-cohort claims experience while the renewal book remained near a 75% claims ratio. The 77-basis-point reduction in retail loss ratio to 67.4% and the 287-basis-point reduction in the company claims-ratio component support that account, although management did not quantify the contribution from lower infection levels, wellness activity or each product cohort.
The next measure to watch is whether fresh cohorts retain their improved claims experience as they mature, especially as ReAssure 3.0 contributes to the new-business mix. Management also disclosed continuing expansion of cost-management initiatives: the PPN had 1,132 hospitals in 49 cities, while common empanelment and further standard treatment workflows were still being rolled out.