










Niva Bupa’s PPN reached 1,132 as claims-cost index hit 163
Key highlights
- Niva Bupa’s Preferred Partner Network reached 1,132 hospitals in H1'FY2027, up from 326 in FY2024.
- Niva Bupa’s retail health claims-cost index increased from 160 in FY2026 to 163 in H1'FY2027.
- PPN cities contributed 22% of Niva Bupa claims in H1'FY2027, compared with 13% in FY2024.
- Niva Bupa processed 90.6% of cashless claims in under 30 minutes in H1'FY2027.
powered by IRIS
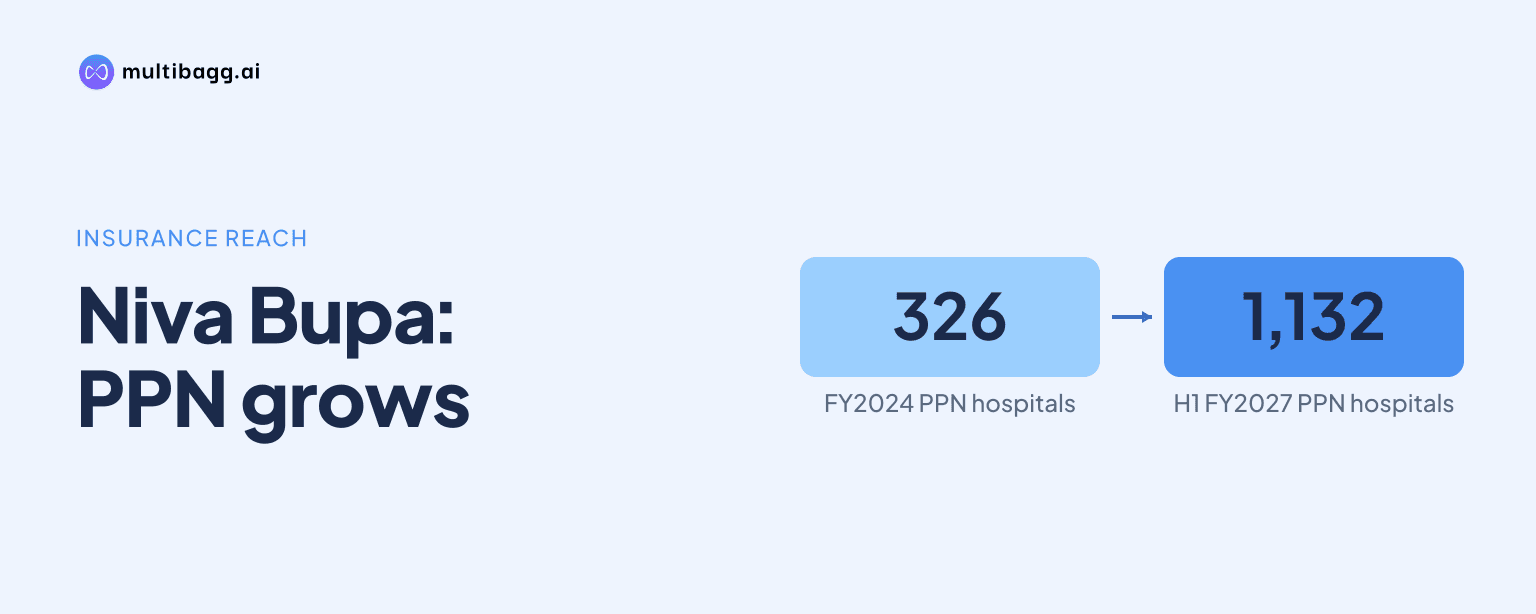
Niva Bupa Health Insurance expanded its Preferred Partner Network to 1,132 hospitals in H1'FY2027 while its retail health claims-cost index reached 163, against an FY2019 base of 100. Niva Bupa is using preferred-provider arrangements, auto adjudication, fraud detection, billing reviews and case management as its disclosed mechanisms to manage claim costs.
Know Niva Bupa Health Insurance Company inside out
Results, valuation, peers and who's buying, in one view.
How much did Niva Bupa’s preferred hospital network expand?
Niva Bupa increased its Preferred Partner Network, or PPN, to 1,132 hospitals in H1'FY2027 from 1,116 in FY2026 and 326 in FY2024. The PPN was live in 49 cities in H1'FY2027, unchanged from FY2026 but more than double the 20 cities reported in FY2024.
The wider hospital network reached 10,780 hospitals in H1'FY2027, up by 214 from 10,566 in FY2026 and by 359 from 10,421 in FY2025. The PPN accounted for 1,132 hospitals within that broader network. Niva Bupa says PPN arrangements provide favourable discount packages and improved billing transparency, while customer benefits include free ambulance services, a designated relationship manager, and post-discharge discounts on pharmacy, diagnostics and consultations.
The PPN expanded faster than the total hospital network over the periods disclosed. The overall network declined by 39 hospitals between FY2024 and FY2025, while the PPN added 263 hospitals. Between FY2025 and FY2026, the PPN added 527 hospitals, compared with a 145-hospital increase in the full network, indicating that Niva Bupa’s reported expansion was concentrated in preferred-provider arrangements.
How much of Niva Bupa’s claims come from PPN cities?
Niva Bupa reported that PPN cities contributed 22% of claims in H1'FY2027, compared with 21% in FY2026 and 13% in FY2024. The increase occurred as PPN city coverage rose from 20 cities in FY2024 to 49 cities by FY2026.
Claims contribution from PPN cities increased by 9 percentage points between FY2024 and H1'FY2027. It rose by 2 percentage points to 15% in FY2025, increased by a further 6 percentage points to 21% in FY2026, and gained 1 percentage point in H1'FY2027. Niva Bupa does not disclose the value of claims handled in these cities, negotiated discount rates or savings generated by the PPN.
Niva Bupa identifies cost control and billing transparency as PPN benefits, but its measure is labelled claims contribution in PPN cities. The disclosure does not state that all claims originating in a PPN city were processed at a PPN hospital. This distinction means the 22% figure measures geographic exposure to cities where the PPN operates rather than confirmed PPN claim penetration.
Got a follow-up? Ask IRIS
Why did Niva Bupa’s claims-cost index rise to 163?
Niva Bupa’s retail health claims-cost index reached 163 in H1'FY2027, up from 160 in FY2026 and 153 in FY2025. The index measures year-on-year average claim size for indemnity claims excluding Covid claims, with FY2019 set as the base year of 100.
The index rose from 100 in FY2019 to 101 in FY2020, then increased to 123 in FY2021, 142 in FY2024 and 160 in FY2026. Niva Bupa reported a compound annual growth rate, or CAGR, of 6.8% from FY2019 to H1'FY2027, compared with 5.3% from FY2021 to FY2026. These growth rates cover different periods, with the longer period including the latest half-year reading.
Niva Bupa attributes index movements to medical-cost inflation, changes in disease mix and medical advancement. The index is a claim-size measure rather than a claims ratio. Separately, its retail claims ratio, including claim-handling expenses, was 67.4% in H1'FY2027, down from 68.1% in H1'FY2026 but above the 66.8% reported for FY2026.
What claims-control tools does Niva Bupa use?
Niva Bupa lists five claims-management mechanisms: partnerships with network hospitals, auto adjudication, fraud detection, billing review and case management. These mechanisms cover provider arrangements, paperless processing, anomaly detection and review of individual claim costs.
The auto-adjudication process uses a paperless portal for health-insurance claim processing. Niva Bupa says its real-time fraud detection identifies claim outliers using disease, treatment provider, location and policy seller. Its billing reviews use random checks and case-specific triggers, while case management reviews cost components on a claim-by-claim basis with medical providers.
Cashless-claims auto adjudication was 39.1% on an H1'FY2027 exit basis, compared with 12.5% in H1'FY2026 and 32.1% in FY2026. Niva Bupa said auto adjudication was on hold during Q1'FY2026 because of information-security assurance reviews across third parties. It also reported that 90.6% of cashless claims were processed in under 30 minutes in H1'FY2027, versus 73.6% in H1'FY2026.
Niva Bupa’s wider digital process reported 90.1% of claims submitted digitally in H1'FY2027, compared with 91.6% in H1'FY2026. It has fraud prediction and auto-adjudication projects in operation, and stated that document-forgery capability was operationalised in Q2'FY2027. The presentation does not quantify fraud prevented, billing reductions or claim-cost savings from these tools.
Conclusion
Niva Bupa’s H1'FY2027 disclosure shows average retail indemnity claim size at an index of 163, or 63 points above the FY2019 base, alongside a PPN of 1,132 hospitals and a 22% claims contribution from PPN cities. The company’s approach combines provider relationships with billing scrutiny, claim automation, fraud detection and claim-level cost reviews rather than relying on a single cost-management measure.
The next disclosures to watch are whether Niva Bupa provides quantified evidence of PPN discounts, fraud prevention or billing savings, which are not included in the presentation. Operational measures also include the 39.1% H1'FY2027 exit rate for cashless-claims auto adjudication and the 90.6% share of cashless claims processed in under 30 minutes.